Google Search Console is a free tool that allows you to track your website’s performance in Google search results. It provides information about issues you need to address to improve your ranking and SEO.
As you know, monitoring your website’s performance is important and crucial. Precise analysis of the site enables you to learn and understand if your optimization efforts are working.
It can additionally help you pinpoint technical problems with your site’s content and aids in shaping your marketing and advertising efforts.
Considering that using Google’s search console can be daunting for new website owners and those at the beginning of their journey, I have decided to write a comprehensive guide that describes the reports and information that Google Search Console provides in a straightforward manner, even for those who have never seen this tool before.
Therefore, I assure you that by the end of this guide, you will know precisely what the graphs in the image below depict and much more beyond that.
But before we begin, we need to understand who Google Search Console is intended for and why you would want to use it…

The Performance tab in Google Search Console
In the past, the tool was called Webmaster Tools and is now referred to by various names: Search Console, Google’s site management tool, Google’s search console, and Google Search Console (abbreviated as GSC).
What is Google Search Console?
So, as we’ve already mentioned – GSC is a free tool that allows website administrators to track, manage, and receive statistics and vital information about the site they manage.
The tool enables Google to communicate with individual site administrators and can be said to be Google’s official way of sending information to these site administrators.
Search Console provides a set of tools that assist in the daily management of the site, primarily providing information that describes the site’s performance and how it appears in Google’s search results.
It offers insights into the site’s performance in organic results, tracks site traffic, identifies issues encountered by Google’s crawler, and even helps you understand which search terms are leading users to your site.
GSC allows you to submit pages to Google’s index, verify that your URLs are “healthy,” and check for domain-wide errors. It’s important to note that Search Console does not allow direct changes to the site.
You can use the tool to establish an SEO strategy and site promotion. The information the tool provides will help you discover new ranking opportunities, improve the ranking of existing pages, and understand how users are reaching your site.
Search Console provides information solely about organic traffic (from Google’s search engine), and it does not provide information about other segments such as direct traffic, traffic from ads, and the like…
Why You Should Use Google Search Console
Search Console includes tools and reports that provide you with the following information (among other things):
- Confirmation that Google can find and crawl your site or specific pages without issues.
- The option to request Google to index new content or re-crawl updated content.
- See how often and for which queries your site appears in Google search results.
- Understand the frequency and number of clicks on the results for those queries.
- Receive alerts when there are index-related issues, spam, or other problems on the site.
- Display sites that link to your site (external links).
- Resolve AMP issues, UX problems, mobile usability, and additional search features…
- Determine whether a specific page on the site is indexed by Google or not.
- Request to submit a site to Google’s index if it’s not appearing in search results.
Who Is Google Search Console For?
1. Business Owners: You should be aware of Search Console and understand the basics of search engine optimization, even if you’re not planning to use the tool actively.
2. SEO Experts or Marketers: Search Console will help you understand how traffic is reaching your site and optimize for informed decisions about your appearance in Google search results.
3. Site Administrators: As site administrators, you need to ensure that your site’s activity is functioning properly. Search Console allows you to monitor errors, loading issues, site scanning, and security problems.
4. Web Developers: If you’re the ones embedding the code, intrinsic data, or relevant tags – Search Console will help you monitor and address issues in this context.
How to Add and Verify a Property in Search Console
To start using Search Console, you need to have a Google email (Gmail). Once you log in, you can add a property (website) by clicking on “Add Property” in the top bar:

This action will display a window where you can enter the site’s address that you want to receive information and track. After adding the address, you will be asked to verify that you indeed own the property.

Note that you have two options for selecting the property type, where one is at the domain level and the other is at the specific URL level. We’ll highlight some differences between the two options and expand a bit on option B:
Option A – Domain
- For all URLs under subdomains (for each subdomain).
- For all URLs under both https and http, with and without www.
- Single verification option – DNS verification.

Option B – URL Prefix
- Only URLs under the entered URL.
- Only URLs under the specified protocol.
- Allows multiple verification methods.

You can choose which option to use to add the property. If it’s not clear – it doesn’t matter which option you choose; Search Console will display the exact same data for you in the end.
Additional information on Option B
First, make sure that you enter the correct URL address, especially check whether your site’s address includes ‘www’ or ‘https’. To gather accurate data, it’s important to add the precise address without errors.
Next, you need to verify that you truly own the property you added. While Option A only allowed property verification through DNS, Option B offers several verification methods:
- Uploading an HTML file to the main directory of your site.
- Adding an HTML tag to your site’s homepage.
- Verification through Google Analytics.
- Using Google Tag Manager.
The easiest and simplest way is to download an HTML file and upload it to the main directory of your site (you can do this using an FTP program).
By the way, if you’re a WordPress site owner using Yoast SEO, you can easily paste the HTML tag you receive in the “Google Verification Code” field under SEO > General > Webmaster Tools.
Regardless of the chosen method, after completing this, you need to return to Google Search Console and click the “Verify” button. If everything is correct, you’ll receive a message that the process was successful, and GSC will start collecting information about the site.
Now, let’s take a look at some reports and information that GSC provides, starting with the “Performance” tab…
Performance
The “Performance” tab in Search Console provides valuable information about your site’s performance in Google search results.

Search Results
As shown in the image above, this tab offers clear data and information regarding:
- Total Clicks – The total number of clicks on URLs belonging to your site in Google search results.
- Impressions – The number of times your site’s URLs appeared in search results.
- Average CTR – The average click-through rate.
- Average Position – The average position of your site in search results.
You can view this data together or select specific data based on the information you want to receive. GSC allows you to group the data by five different dimensions:
- Queries – View the search terms/phrases for which your site’s pages were ranked over a specific time.
- Pages – See the pages that are ranked and appear in search results.
- Countries – View the geographical location (by country) of the audience.
- Devices – Observe how traffic to your site is divided by devices (desktop, tablet, mobile).
- Search Appearance – Show pages appearing in search results as Rich Snippets or AMP pages.
You can also filter specific information to target data from each of these dimensions. You can also filter information by dates. Search Console allows you to see the past 16 months of data. For many, this isn’t sufficient, and they use paid tools to see a wider date range.
The Countries dimension is especially handy when you optimize for a market you are not in. It shows your real clicks and average position for that country, straight from local searchers. To see what that country’s live results page actually looks like, here is how to see Google results in another country.
In any case, as promised, I will provide a detailed explanation of each of the displayed data points:
1. Total Clicks
The number of clicks indicates how many times users clicked on URLs belonging to your site in Google search results. The number of clicks can sometimes indicate that the title and description might not be captivating enough, and you should optimize the Meta Titles & Descriptions of the specific page.
If a specific URL receives a low number of clicks, it’s possible that this result isn’t prominent enough in Google’s search results.
The position of the result in Google’s search results directly affects this data. If your page is within the top three results on the first page, it’s highly likely that the number of clicks for that page will be higher than for a result on the second page.
2. Impressions
“Impressions” indicate the number of times a certain URL belonging to your site is displayed in Google search results. An URL is considered as having an impression even if it’s located below the user’s viewport (“below the fold”), requiring scrolling to see the result.
An URL doesn’t count as an impression if it’s on the second page or beyond, only if the user actively clicked to see that page.
3. Average CTR
CTR stands for Click-Through Rate. It represents how many times a user saw a result from your site in search results and actually clicked on it. You can calculate CTR by dividing the number of clicks by the number of impressions (Clicks/Impressions).
If a specific URL received 1,000 impressions and 100 clicks, the CTR for that URL would be 10%.
4. Average Position
The “Average Position” indicates the numerical position of a specific URL in Google search results. The position is calculated from top to bottom, where 1 represents the first organic result.
The term “average” signifies that this data doesn’t precisely represent the position of a page at any given time. If a page appeared as the third result one day, the seventh result the next day, and then the fourth result, the average position in this case would be 4.6.
Features like AMP carousels, in which Google displays multiple URLs, will consider all those URLs as having the same position.
URL Inspection
Before we dive into the “Indexing” section of GSC, let’s talk about the “URL Inspection” tool which allows you to take a look at individual URLs on your site. This tool should be used to:
- Check the indexing status of that URL.
- Confirm whether this URL can be added to the index.
- Request Google to crawl (or recrawl) a specific page or URL.
- Understand how Google’s bot actually views the page.
- Get a list of resources loaded on the page and see the page’s code.
It’s important to note that this is not a live check but a tool that displays the latest version in the index of that URL. To perform a live test of the page in question, click the Test Live URL button.
So, to test a specific URL, click on the “URL Inspection” tab, enter the address you want to check in the search bar at the top of the screen, and review the results:

Note the green checkmark on the right and a small arrow on the left in the result of each of the tests performed for this page. Clicking the arrow will display additional information relevant to that test.
For example, clicking the arrow next to “Coverage” will open a window that displays additional information about that specific URL you tested.
You can see when this URL was last crawled by Google, whether it was crawled from desktop or mobile, and even see which canonical URL is defined for the page compared to the one Google chose.
By the way, testing the canonical URL defined on the site against the one Google chose is an excellent way to detect duplicate content.
The tool will also indicate errors and issues on the inspected page, such as:
- If there are problems with the code, the structure, issues related to Rich Snippets, and more.
- If there is a problem with adding the page to the index.
- If the content is password-protected or if the noindex tag is present, and so on.
“The URL Inspection Tool is perfect for in-depth checks on individual URLs, but broader insights require other tools in the Google Search Console suite.”
How to Request Indexing with the URL Inspection Tool
If you’ve recently added or updated a page and want Google to index it promptly, you can use the URL Inspection Tool to request indexing. Here’s how:
- Open Google Search Console and select your property.
- Enter the URL you want to inspect in the search bar and press Enter.
- If the page isn’t indexed, you’ll see an option to Request Indexing.
- Click Request Indexing and wait for Google to process the request.
When and When Not to Use “Request Indexing”
The “Request Indexing” option is best used sparingly. Here are cases where it is effective:
- Newly Published Content: When you publish a new page, you may want it indexed as soon as possible. Requesting indexing prompts Google to add the page to its crawling queue, potentially accelerating its appearance in search results.
- Significant Updates: If you make substantial updates to the page content, such as adding new sections or changing important information, requesting re-indexing helps Google reflect these changes quickly in search results.
Avoid using the “Request Indexing” feature too frequently for minor changes. Overusing the feature can lead to delays or restrictions on your indexing requests.
For minor content updates, Google will naturally re-crawl your page eventually based on its crawl frequency and sitemap updates.
Does Request Indexing Only Apply to the Specific Page?
Yes, “Request Indexing” only affects the specific URL that you submit. Google will re-crawl only the requested page and not follow internal links to other pages on your site.
Therefore, if you’ve made changes to multiple URLs, each needs to be inspected and re-indexed individually. For large-scale changes, using an updated XML sitemap may be more efficient to alert Google about changes across many pages.
That’s all about the URL Inspection. Let’s move on to the next tab in Google Search Console called “Indexing”…
Indexing
The “Indexing” tab is also very useful, but more technical than the Performance tab.
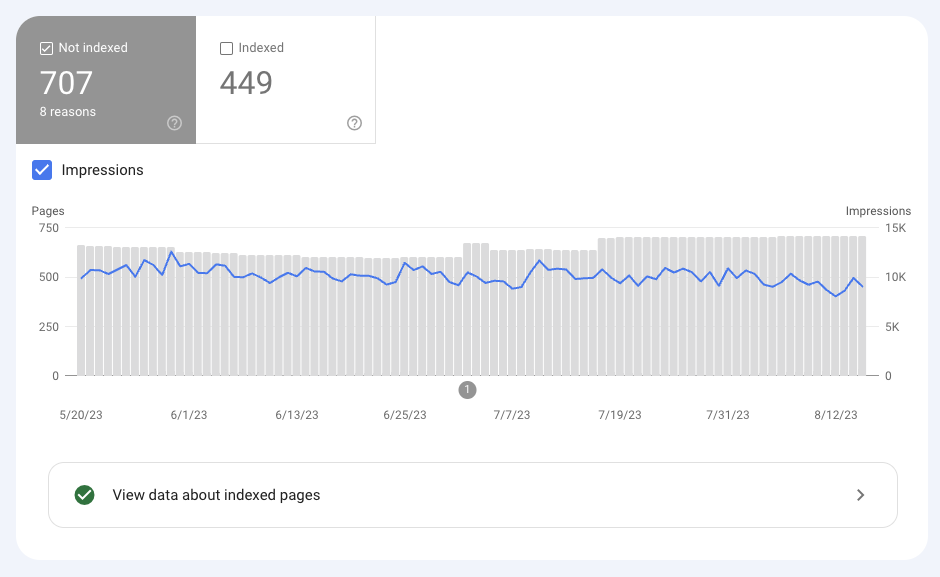
A. Pages
The “Pages” report allows you to see the index status of each URL that Google visited or attempted to visit.

The main page groups the results by status (error, warning, valid) and displays the reason for that status. The reason could be issues related to redirects, 404 errors, server errors (500), scanning issues, problems with canonical URLs, URLs blocked from crawling due to the noindex tag, and more.

Clicking on a specific error will allow you to perform a deeper analysis of that error and show you the specific URLs affected by that error. After you’ve fixed the error, you can mark it as fixed and request Google to check that URL again and confirm that the error has been resolved:

When the affected URLs are 404s, the next step is to trace each one back to its source. Here is how to find where your 404 errors come from so you can decide whether to fix a link or add a redirect.
It’s recommended to regularly check the Indexing tab to see which errors and issues exist on your site. Pay special attention to extreme changes in the graph, as they might indicate a serious issue with the site’s scanning.
Tip – Make Sure Excluded Pages Should Be Excluded
Despite what I mentioned earlier, I’ll dwell on this topic a bit. There can be many reasons for search engines to exclude a page from indexing. For example, a login page, possibly duplicate content, or the page might have low value.
When I say “low value,” I don’t mean that the page has no value to users, but rather that it might not be valuable to search engines.
Nevertheless, make sure Google includes all the important pages on your site in the index and that important pages aren’t listed under the “Excluded Pages” section.
If you scroll down, you’ll see the reason why each page is not included in Google’s index:
The reasons for these pages not being included in the index can vary. For example, the page’s status might redirect to another page, Google might have found an alternative version of the page elsewhere due to a canonical tag, or the page might be blocked by the robots.txt file, and so on.
In conclusion, ensure that the “Indexing” tab doesn’t list pages you want to appear in search results.
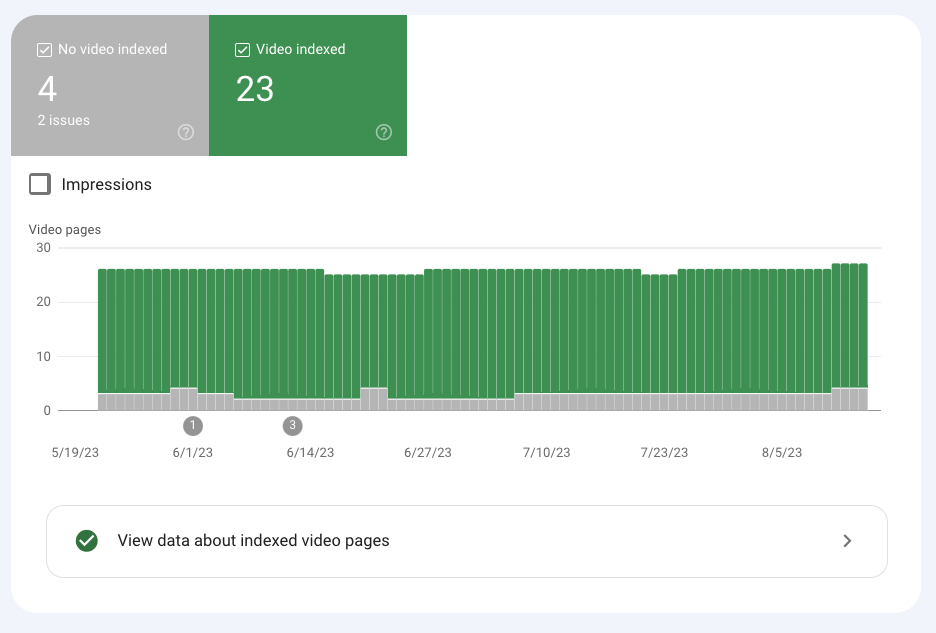
B. Video Pages
This report displays the indexing status of video pages in a similar way to how we saw it with regular pages in the previous section.
Search Console will provide you with information about the number of videos added and information about issues preventing videos from entering Google’s index.
C. Sitemaps
An XML Sitemap is a kind of roadmap for all the important pages and posts on your site. Generally, a sitemap is necessary mainly for larger websites, aiming to guide search engines to those pages and thus avoid situations of wasting crawl budget on less important and less frequently changing pages.
However, you’re welcome to add a sitemap even on smaller sites; it won’t hurt. In the Sitemaps tab of Google Search Console, you can indicate the location of your property’s sitemap file on your server:

D. Removals
The Removals tool performs three functions:
- Allows you to temporarily hide URLs from Google search results.
- Displays content that is no longer available on Google due to being outdated.
- Shows URLs that were filtered by “SafeSearch” or the SafeSearch adult filter.
1. Temporary Removals
Google enables you to quickly remove URLs from search results using the removals console. The action doesn’t actually delete the URL from the index; it just hides it from search results for about six months.
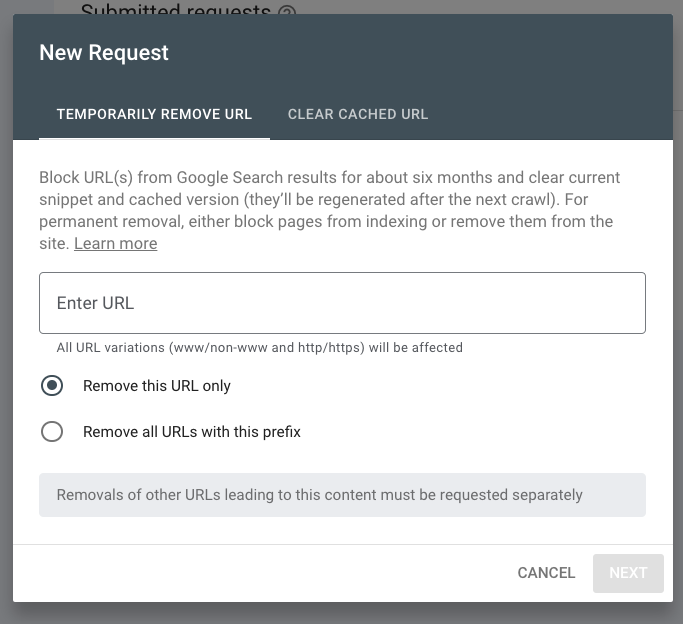
There are two types of removals:
- Temporary removal hides the URL from search results for six months and clears the cached copy of the page.
- Cleaning the cache clears the existing page from the cache and removes the page’s description from search results until the page is recrawled by Google.
2. Outdated Content
The “Outdated Content” tab provides information about removal requests for outdated content made by the public removal tool, which everyone can use to update search results showing content that is no longer available on a specific page.
In this section, you can see the history of all requests made by the outdated content removal tool in the last six months.
3. SafeSearch Filtering
This section displays URLs in the property that were reported to contain adult content by SafeSearch users. Anyone can report content as adult content using the SafeSearch Suggestion tool.
This tool helps SEO professionals and site administrators know what content of theirs has been removed due to SafeSearch filtering and provides them with this information.
User Experience
In the User Experience section, you will find information about page quality and mobile usability from a user experience perspective.
A. Page Experience
The “Page Experience” report combines the Core Web Vitals report with other relevant metrics that impact your site’s ranking in search engines. Google rolled out the Page Experience Update in 2021-2022, making these signals an active part of its ranking algorithm.
The Page Experience report now covers both mobile and desktop page quality.
The report aggregates data on the following:
- The Core Web Vitals report.
- Mobile Usability.
- HTTPS.
- Security Issues.
- Ad Experience.
Here’s a screenshot of how the new report looks:
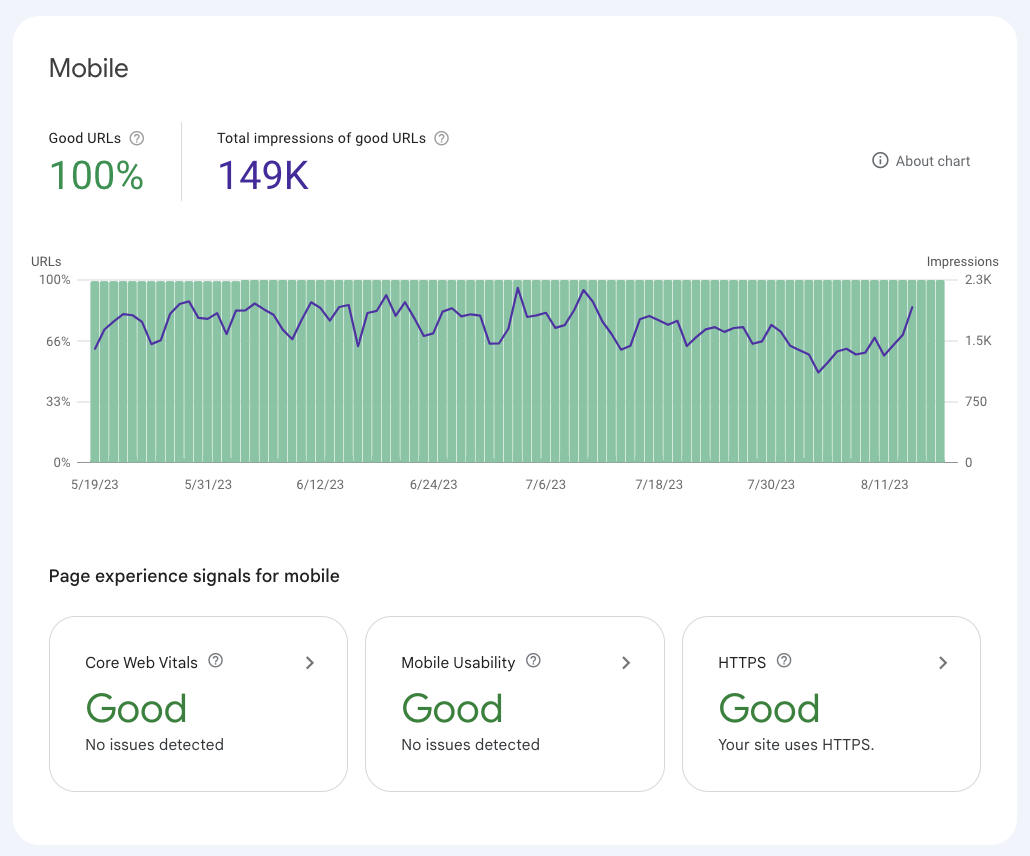
This report provides metrics such as the percentage of URLs defined as having a good user experience along with the impressions graph over time. This information makes it easy to evaluate your site’s performance relatively quickly.
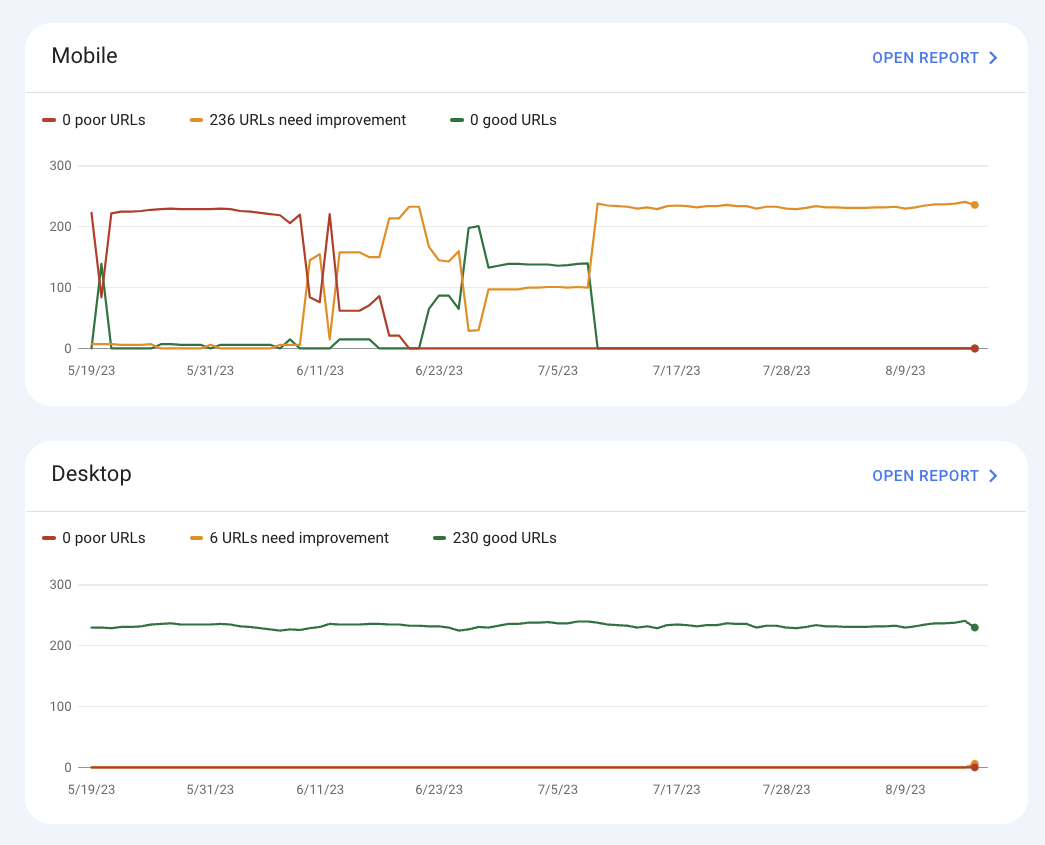
B. Core Web Vitals Report
The “Core Web Vitals Report” provides information about page loading speed and interactivity as experienced by users on your site.
The report focuses on the three Core Web Vitals metrics: Largest Contentful Paint (LCP) for loading speed, Interaction to Next Paint (INP) for responsiveness, and Cumulative Layout Shift (CLS) for visual stability.
Since May 2021, Google has incorporated these metrics as a ranking parameter. In March 2024, Google replaced the First Input Delay (FID) metric with Interaction to Next Paint (INP), which measures responsiveness across all page interactions.
You can view this information separately for desktop and mobile, and the data is divided between URLs that load slowly, moderately, and quickly. Here’s an example of how this information looks in the Savvy Blog:
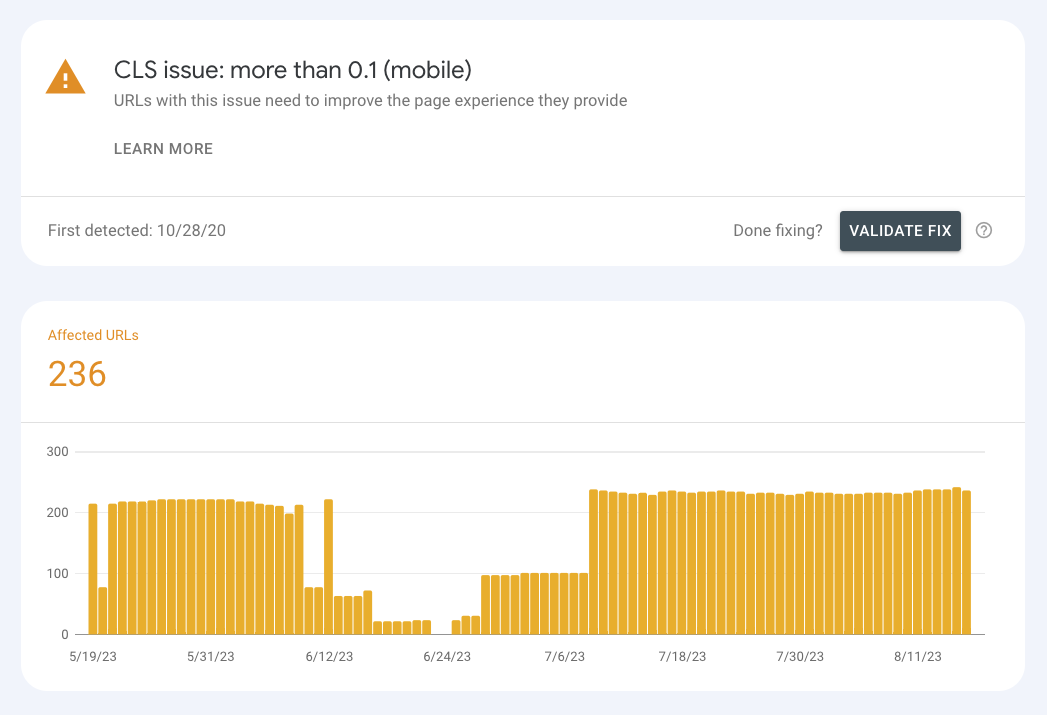
You can also click on “Open Report” to get more information about the issue. Here’s an example of a report showing an issue with Cumulative Layout Shift (CLS):
C. Mobile Usability
The “Mobile Usability” tab displays issues with your site’s pages on mobile devices. These issues can be related to UX and user experience, such as text being too small, buttons being too close to each other, horizontal scrolling when content width is larger than the screen width, and so on.
As the number of mobile users continues to grow over time, it’s essential to ensure that your site is smooth and user-friendly on these devices. The Mobile Usability tab will show you the problems related to this aspect that you need to fix.

As shown in the screenshot, Google will display all existing URLs as either valid or containing errors, based on issues related to the user experience of the page on mobile devices. Clicking on a specific error will display all the URLs that have this error, helping you identify which pages to address.
If a specific page has multiple issues, it will appear under each of the displayed errors.
URLs that are marked as valid meet Google’s minimum requirements for mobile user experience. It’s possible that a certain page might have issues but they are not severe enough to be considered an error. In such cases, you can use Google’s PageSpeed Insights (powered by Lighthouse) to check for mobile usability issues.
Before concluding this section, it’s important to keep the following points in mind regarding Mobile Usability:
- If your site has numerous mobile usability issues, Google recommends addressing them in the order they appear in the report you receive.
- If you have a site with thousands of pages, remember that Google will display only the first 1,000 problematic pages. However, there might be additional pages with issues.
Once you’ve fixed a specific issue, you should return to the page displaying the list of issues and click the Validate Fix button. This will prompt Google to re-crawl those pages and update the status to “Valid” if they meet the mobile usability requirements.

D. HTTPS
The HTTPS report will show you how many URL addresses on your website (which exist in the index) run on the HTTPS protocol and how many URLs run on HTTP. It is advisable, of course, to ensure that all addresses operate on HTTPS for a number of reasons, including performance, security, and maintaining user privacy.
If there are pages on your site that operate on both protocols, Google will prioritize indexing the address in the HTTPS version. For more information on the HTTPS protocol and its benefits, take a look at the post Speed and Optimization in the HTTP/2 Era.
Enhancements
Under the “Enhancements” section, you’ll find additional options that are not available to all Google Search Console users. These options include Breadcrumbs, Logo markup, Events, Sitelink Search Box, and more. These options will be visible only if you have implemented relevant structured data on your site.
Similarly, the Accelerated Mobile Pages (AMP) section will appear in Google Search Console only if you’re using AMP on your site. So, if you don’t see these options, there’s no need to worry.

If you have structured data on your site, you’ll also find information about Unparsable structured data under this section. It will provide details about parsing errors related to structured data, including those that Google couldn’t identify and parse.
If you encounter errors in this section, you can use the Rich Results Test or the Schema Markup Validator to get more detailed information about the identified errors.
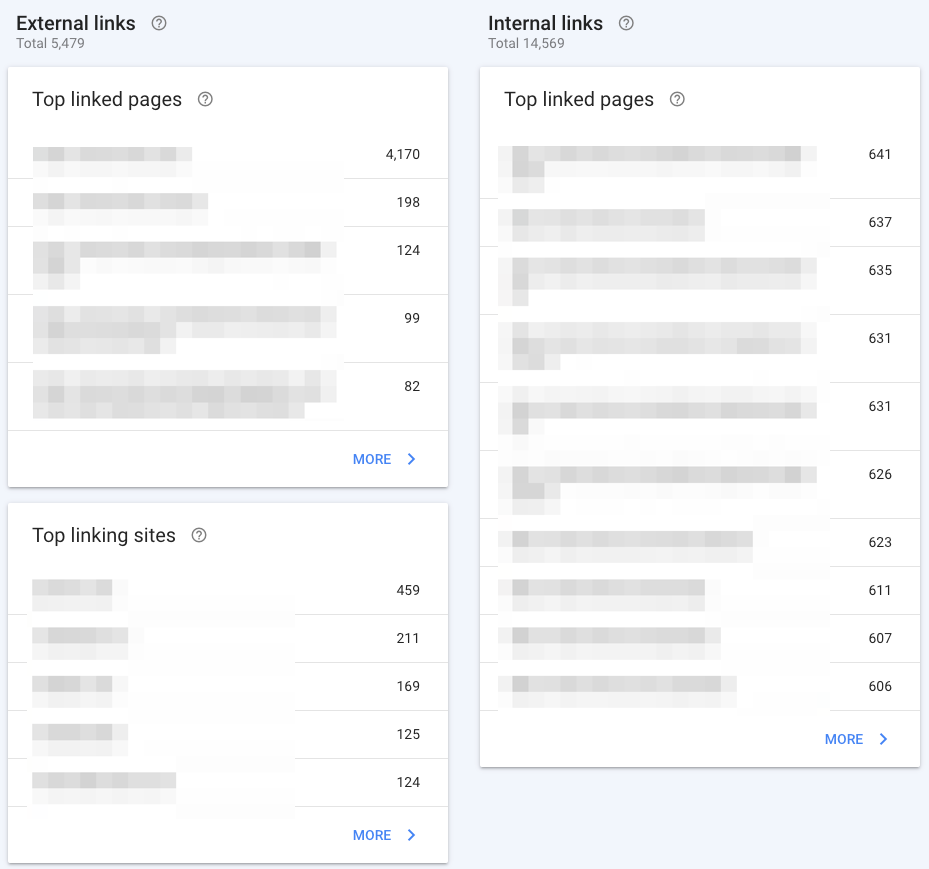
Links
The “Links” tab will display the number of external links pointing to your site. You can see which sites are linking to your site and how many links are coming from each site. Additionally, you can also view the Anchor Text for each of these links.
You can also gather more information from this tab, including the number of internal links within your site. It will also show which pages have the highest number of internal links, which can provide valuable insights for SEO and optimization purposes:
You can export this data by clicking the “Export External Links” button in the upper left corner of this tab.
Security & Manual Actions
Under the “Security” tab, you’ll receive notifications if Google detects any security issues on your site, such as malware or code injections.
In the “Manual Actions” section, you’re likely not to see anything unless your site has been penalized by Google. If that happens, you’ll receive additional information in this section along with relevant emails.
Settings
Under the “Settings” tab, you can view property settings. Here, you’ll find information about property verification, user permissions for property access, adding or removing users from the property, and changing the domain of the site. You can also report changes of address in this section.
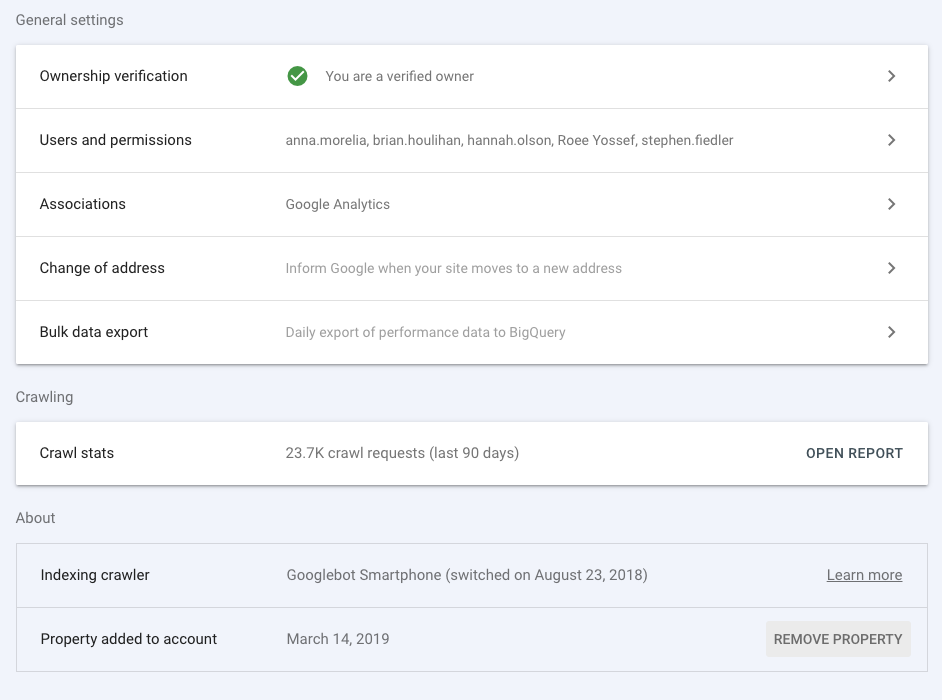
In this section, you’ll also find another report called Crawl Stats…
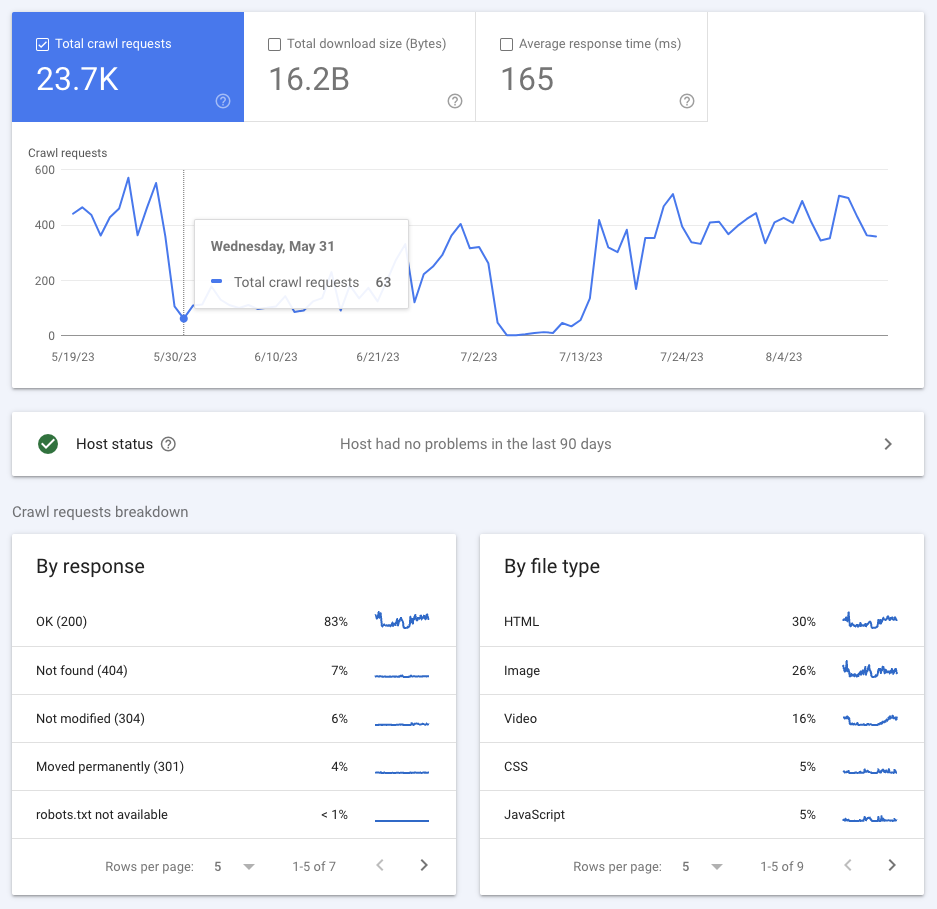
Crawl Stats
The report named Crawl Stats provides detailed statistics about the historical crawl activities that Google has performed on your site. It includes information such as the number of requests made, server response, and whether Google encountered any issues during the crawl.
You can access this report by clicking on Settings and then “Open Report” under Crawl Stats.
This report is particularly useful for advanced users. If your site has fewer than 1000 pages, you may not need to pay special attention to this report and its crawl frequency. However, you should periodically check the Host Status tab to ensure that there are no recurring issues with your site’s crawl availability.
Appendix
This appendix highlights newer and less visible Google Search Console features that are worth knowing, even if they don’t appear in the main reports.
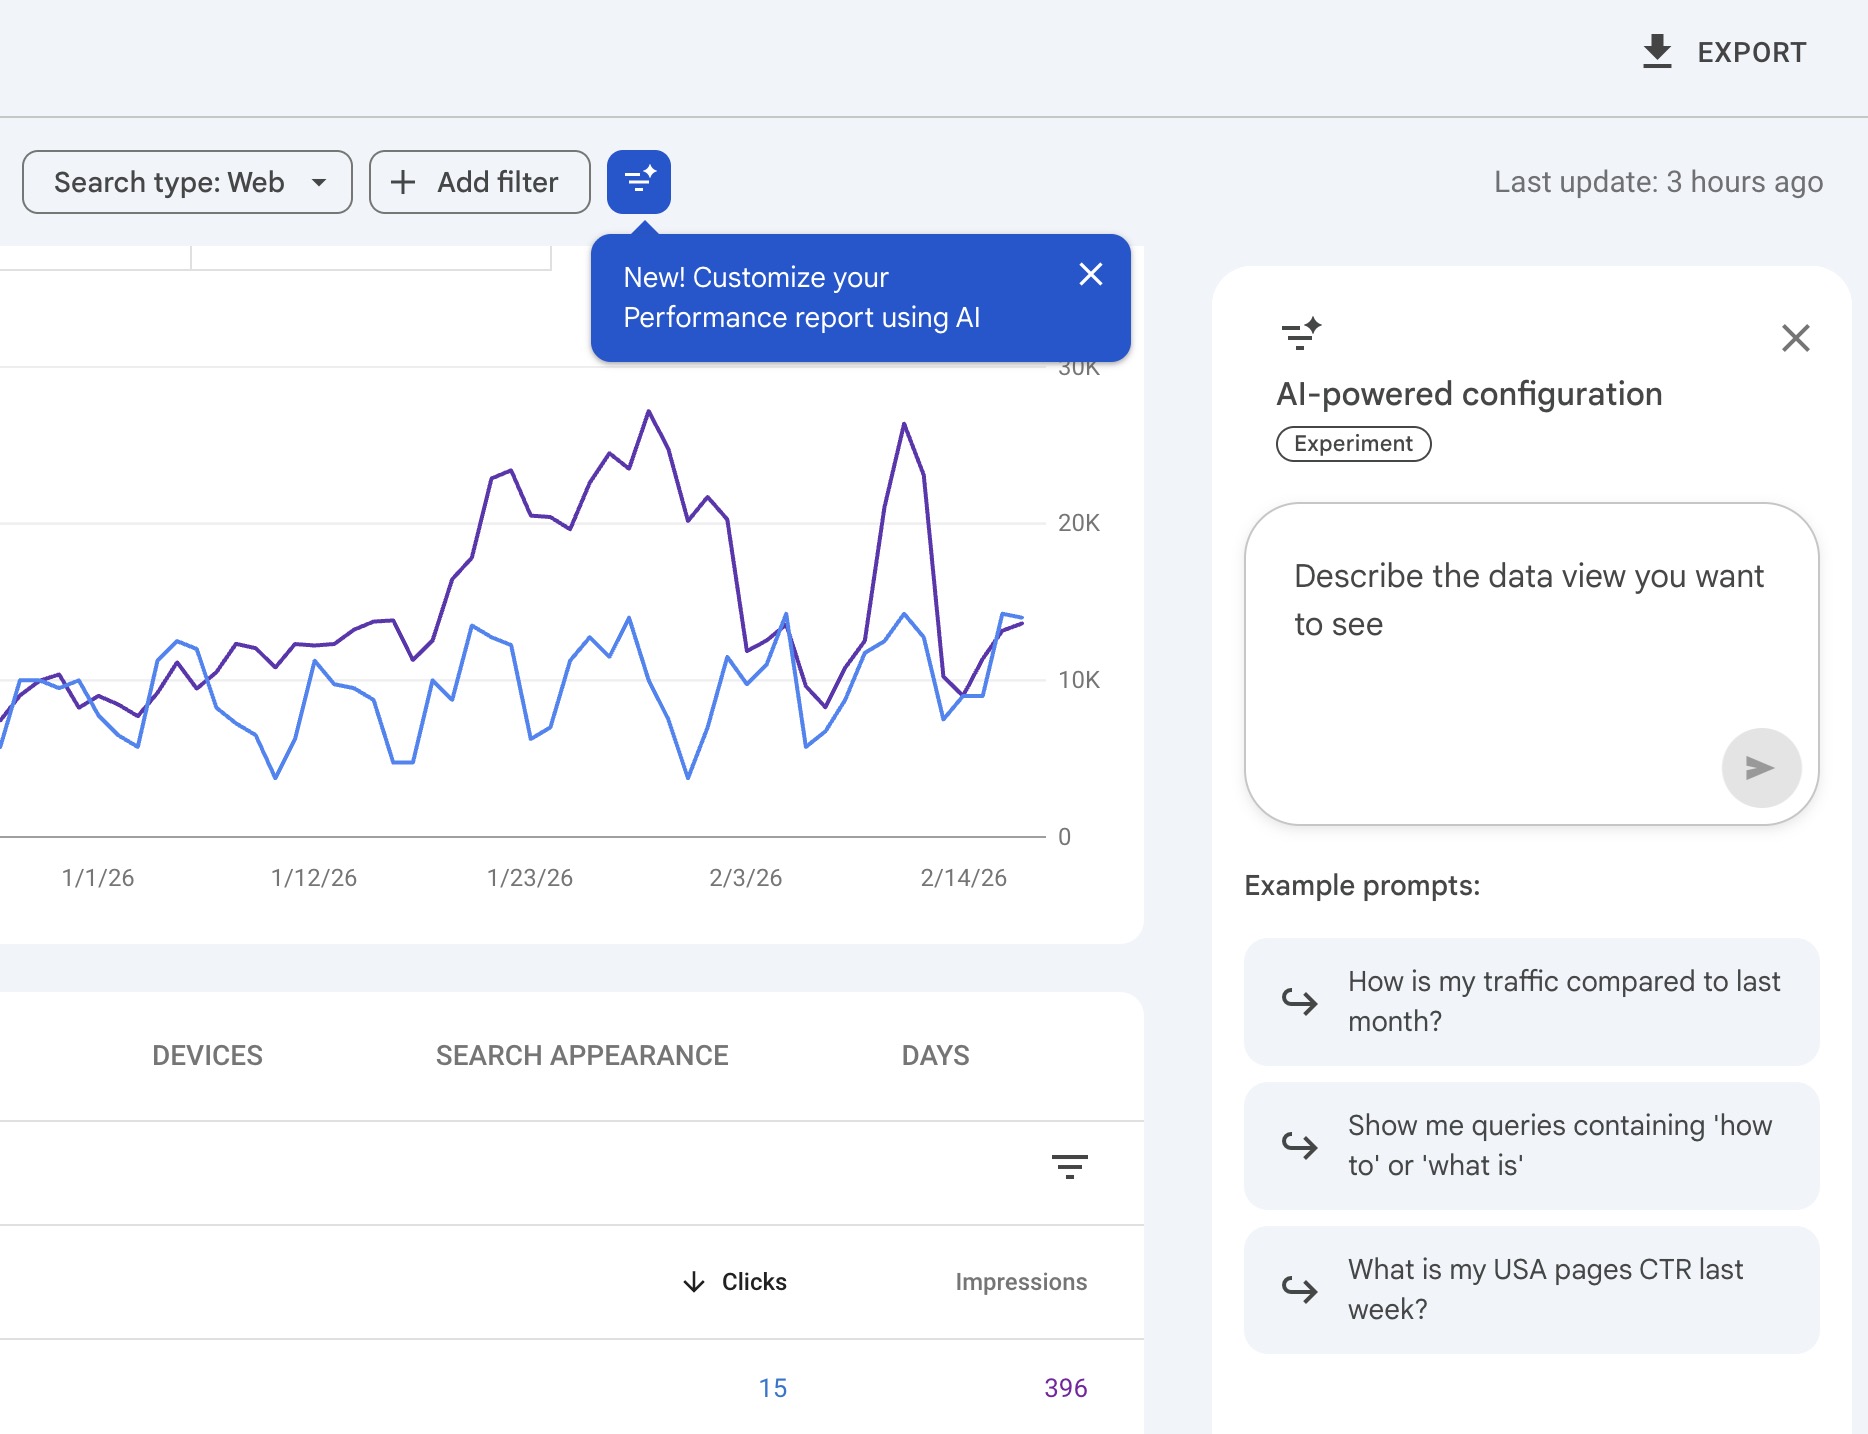
AI-Powered Report Configuration
In December 2025, Google added AI-powered configuration to the Performance report. You can now type natural-language prompts – such as “show queries where clicks are flat but impressions are rising” – and Search Console will automatically build the matching report view.
This saves time compared to manually stacking filters and is especially helpful for spotting trends you might not think to filter for.
AI-Powered Report Configuration
Recommendations in GSC
Google Search Console now includes a Recommendations section, offering personalized tips to help you improve your site’s performance on Google Search. These suggestions may include indexing fixes, structured data improvements, or opportunities to gain more visibility.
You’ll find this feature on the Overview page of your Search Console. Each recommendation is based on your site’s actual data and can help you identify technical or content-related improvements.
Search Console annotations
Google Search Console annotations add context directly to Performance report charts, helping explain changes in clicks, impressions, or rankings. Google adds system annotations automatically, while custom annotations let you mark key events like launches, fixes, or major updates.
To add one, open the Performance report, right-click the chart on the relevant date or select it from the date picker, enter a short note (up to 120 characters), and click Add.
Annotations are shared across the property, can’t be edited, are limited to 200, and are removed after 500 days.
FAQs
Common questions about Google Search Console:
noindex tag on the page, the URL being blocked by robots.txt, a canonical tag pointing to a different URL, redirect chains, or Google determining the page has low value or is duplicate content. Check the Indexing > Pages report for the specific reason, and use the URL Inspection tool to diagnose individual URLs.Summary
Google Search Console is the primary free tool for understanding how Google sees your website. It covers everything from Performance data and indexing status to Core Web Vitals and security alerts, giving you a clear picture of your site’s health in search results.
If you are new to GSC, start by exploring the Performance report and the URL Inspection tool. These two features alone can reveal ranking opportunities, indexing problems, and content that needs optimization. Over time, make it a habit to check the Indexing and Core Web Vitals reports regularly.
For a more hands-on guide, check out the post on how to use Google Search Console data to improve your site’s organic rankings. It’s also worth mentioning that connecting GSC to Google Analytics gives you an even more complete view of your traffic.


Hi Roee, Thanks for the comprehensive post!
Question: How can I link Google Search Console to Google Analytics?
Hi John,
In short – To link Google Search Console to Google Analytics, go to your Google Analytics account and navigate to the ‘Admin’ section. Under the property settings, you’ll find an option to ‘Adjust Search Console.’ From there, you can add or edit a Search Console association and select the appropriate website you want to link to from the list of sites you manage in Search Console.
FYI – I have a post explaining how to connect Google Search Console to Google Analytics in more details…
Can you explain how do I interpret the Performance report in Google Search Console for optimizing my content?
Hi Suzan,
Basically the Performance report provides metrics such as clicks, impressions, click-through rate (CTR), and position.
To optimize content, look for queries where your site has a high number of impressions but a low CTR or where your page ranks on the lower end of page one or on page two. These are opportunities to improve titles, meta descriptions, or content to better capture user attention and improve rankings.
Hope that helps!