Optimizing user experience is the key to success for every website on the internet. Whether you’re a business owner, marketer, or developer, Core Web Vitals can help you enhance the experience on your site and identify opportunities for improvement.
Core Web Vitals is an initiative by Google that provides unified guidelines for signals representing quality that are essential for a better and more accurate user experience on the web.
Over the years, Google has provided various performance measurement tools. Some of these tools are used by proficient developers, while others may struggle to keep up with the tools and metrics available in this context.
As Google aims to make it possible for website owners to understand user experience quality on their site without being performance experts, this initiative simplifies the landscape for those site owners and helps them focus on the most important metrics. These metrics are the same Core Web Vitals.

Core Web Vitals – LCP, INP & CLS
Page Experience Signals
The focus on the user and how well they are served by search results led Google to emphasize an additional aspect beyond content – this aspect being the user experience that visitors to your site encounter.
These same Page Experience Signals represent a set of metrics unrelated to the content quality on the site and are used by Google to evaluate the user experience (UX) of a specific site.

Page Experience Signals – Core Web Vitals
The metrics described in the image include (among others):
- Loading
- Interactivity
- Visual Stability
- Mobile Friendliness
- HTTPS (Connection Encryption)
The first three of these metrics are known as Core Web Vitals and have been used as ranking signals in Google search results since mid-2021. Note that Safe Browsing was removed as a page experience signal in August 2021, as Google determined that security issues are not always within the control of site owners.
How to Improve Your Core Web Vitals Scores?
Core Web Vitals are not just a generic definition for UX metrics that Google considers when assessing the quality of a website. They are also a set of metrics with detailed explanations of how they are measured, what values are considered good, values that require improvement, or metrics that are not good.
1. Loading: Largest Contentful Paint (LCP)
The final loading time of a site does not represent a reliable universal value in the context of user experience, as most of the page is usually below the critical upper part of the page (BelowTheFold), which is not visible without scrolling.
The LCP indicator measures the perceived loading speed. Its value is the time it takes to load the largest text block or graphical element in the critical upper part of the page (AboveTheFold).
The LCP score evaluation is as follows:
- Good LCP score: Under 2.5 seconds.
- Needs improvement LCP score: Between 2.5 and 4 seconds.
- Poor LCP score: Above 4 seconds.

LCP score evaluation – Core Web Vitals
Here is more information about Largest Contentful Paint (LCP).
How to Improve LCP Score?
The following optimization tasks will have an impact on the LCP scores your site receives:
- Optimize server response time.
- Improve TTFB.
- Optimize images.
- Optimize fonts.
- Optimize CSS styles.
Check out the detailed post I’ve written about what LCP is and how to improve your LCP score.
2. Interactivity: Interaction to Next Paint (INP)
Loading and rendering a site is one thing, but getting the site ready for interaction is another. INP, just like LCP, relates to the speed of the site. It measures the time it takes for a page to respond to a user action, such as clicking a button.
The INP score evaluation is as follows:
- Good INP score: Under 200ms.
- Needs improvement INP score: Between 200ms and 500ms.
- Poor INP score: Above 500ms.

Check out the detailed post I’ve written about what INP is and how to improve your INP score.
How to Improve INP Score?
The following optimization tasks will have an impact on the INP scores your site receives:
- Reduce the impact of third-party code.
- Reduce the runtime of JavaScript code on the site.
- Reduce the number of HTTP requests to the server and, in general, reduce the site’s weight (traffic volume).
More information about INP optimization can be found at the provided link. Note that lab tools like Lighthouse cannot measure INP directly (it requires real user interactions), so they display Total Blocking Time (TBT) as a proxy metric instead.
3. Visual Stability: Cumulative Layout Shift (CLS)
This is a metric of visual stability. You have likely encountered the frustrating situation where you intend to click an option in a menu, move your mouse pointer to the desired place, and just before clicking, the menu shifts down, and a large banner appears in its place, “stealing” your click.
CLS is a concept for measuring the total value of sudden changes, those Layout Shifts of elements on a page while the page loads or is displayed.
The CLS score evaluation is as follows:
- Good CLS score: Less than 0.1.
- Needs improvement CLS score: Between 0.1 and 0.25.
- Poor CLS score: Above 0.25.

CLS score evaluation – Core Web Vitals
Note that unlike the other two metrics, the CLS score is not measured over time but is presented as an absolute number. More information about Visual stability: Cumulative Layout Shift (CLS).
How to Improve CLS Score?
The following optimization tasks will impact the CLS scores your website receives:
- Adding dimensions to image and video objects.
- Saving space using CSS for elements that will be loaded.
- Avoiding adding content above existing content after the DOM loads.
- Preventing animations that shift the position of objects.
More information about optimizing CLS can be found at this link. Additionally, take a look at a more comprehensive post by Shai Toder that explains Cumulative Layout Shift (CLS) metric and ways to improve this score.
Lab Data vs Field Data
For each site’s Core Web Vitals, there are two sources of data:
- Lab Data – Measurements made using special tools.
- Field Data – Collected during visits by real users with Chrome browsers.
Lab Data is measured using the Chrome browser, Page Speed Insights, Web.dev, and also by the beloved WebPageTest.
You can measure and perform these measurements yourself using open-source code provided by Google.
On the other hand, Field Data is collected by Google specifically, as an average over the last twenty-eight days. You can obtain this data using the Chrome UX Report API – either by logging in or using PSI, Search Console, or even the CrUX API tool. Let’s take a look at some of these tools…
How to Measure the Values of Core Web Vitals?
As mentioned, Google provides documentation and a set of tools for testing LCP, INP, and CLS independently. Additionally, it offers free access to field data collected by thousands of users accessing your site with Chrome.
Google Search Console also provides data on the same Core Web Vitals. Check out the Page Experience report for more details.
So, here are several ways to measure those metrics called Core Web Vitals:
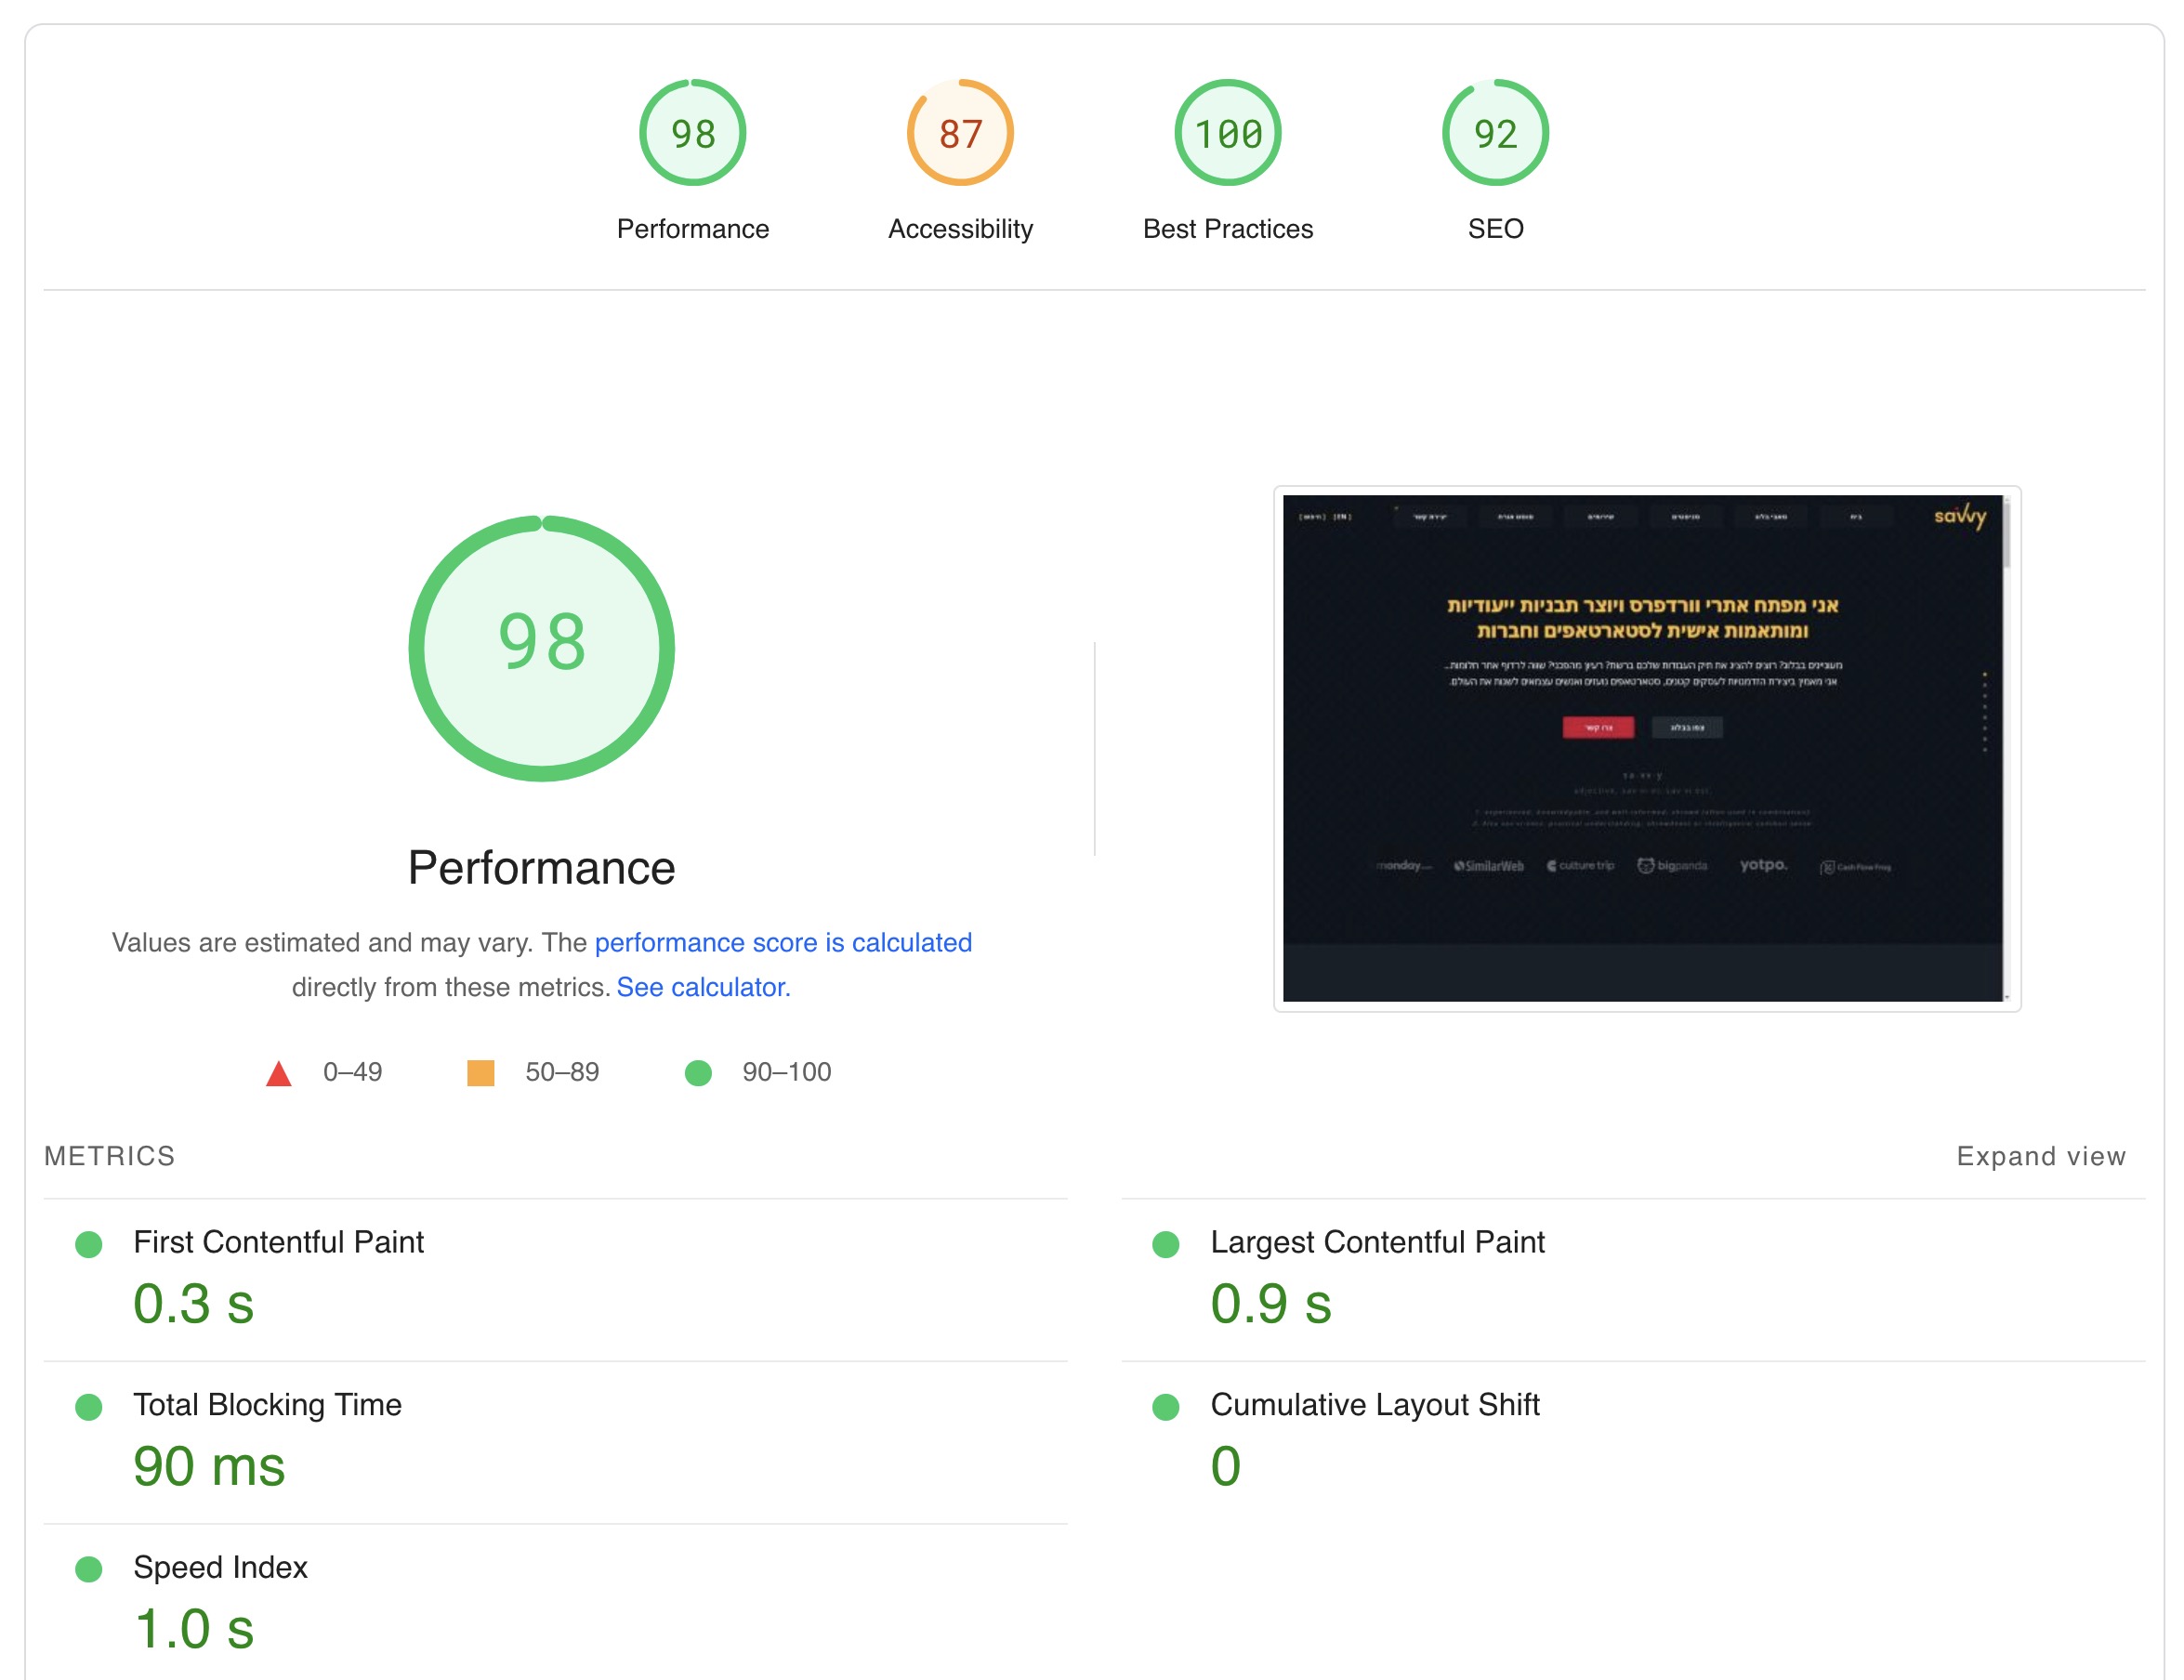
1. Google’s Page Speed Insights Tool
Recently, the Page Speed Insights tool began displaying Core Web Vitals field data from the Chrome UX Report API, in addition to Lighthouse-based data. These are collected only for pages with substantial data.
If you’re interested in this topic, here’s a two-part series I wrote about Page Speed Insights.
2. WEB.DEV
The web.dev site by Google is the go-to resource for Core Web Vitals documentation, best practices, and optimization guides. The old web.dev/measure testing tool now redirects to PageSpeed Insights, so use PSI for running tests directly.
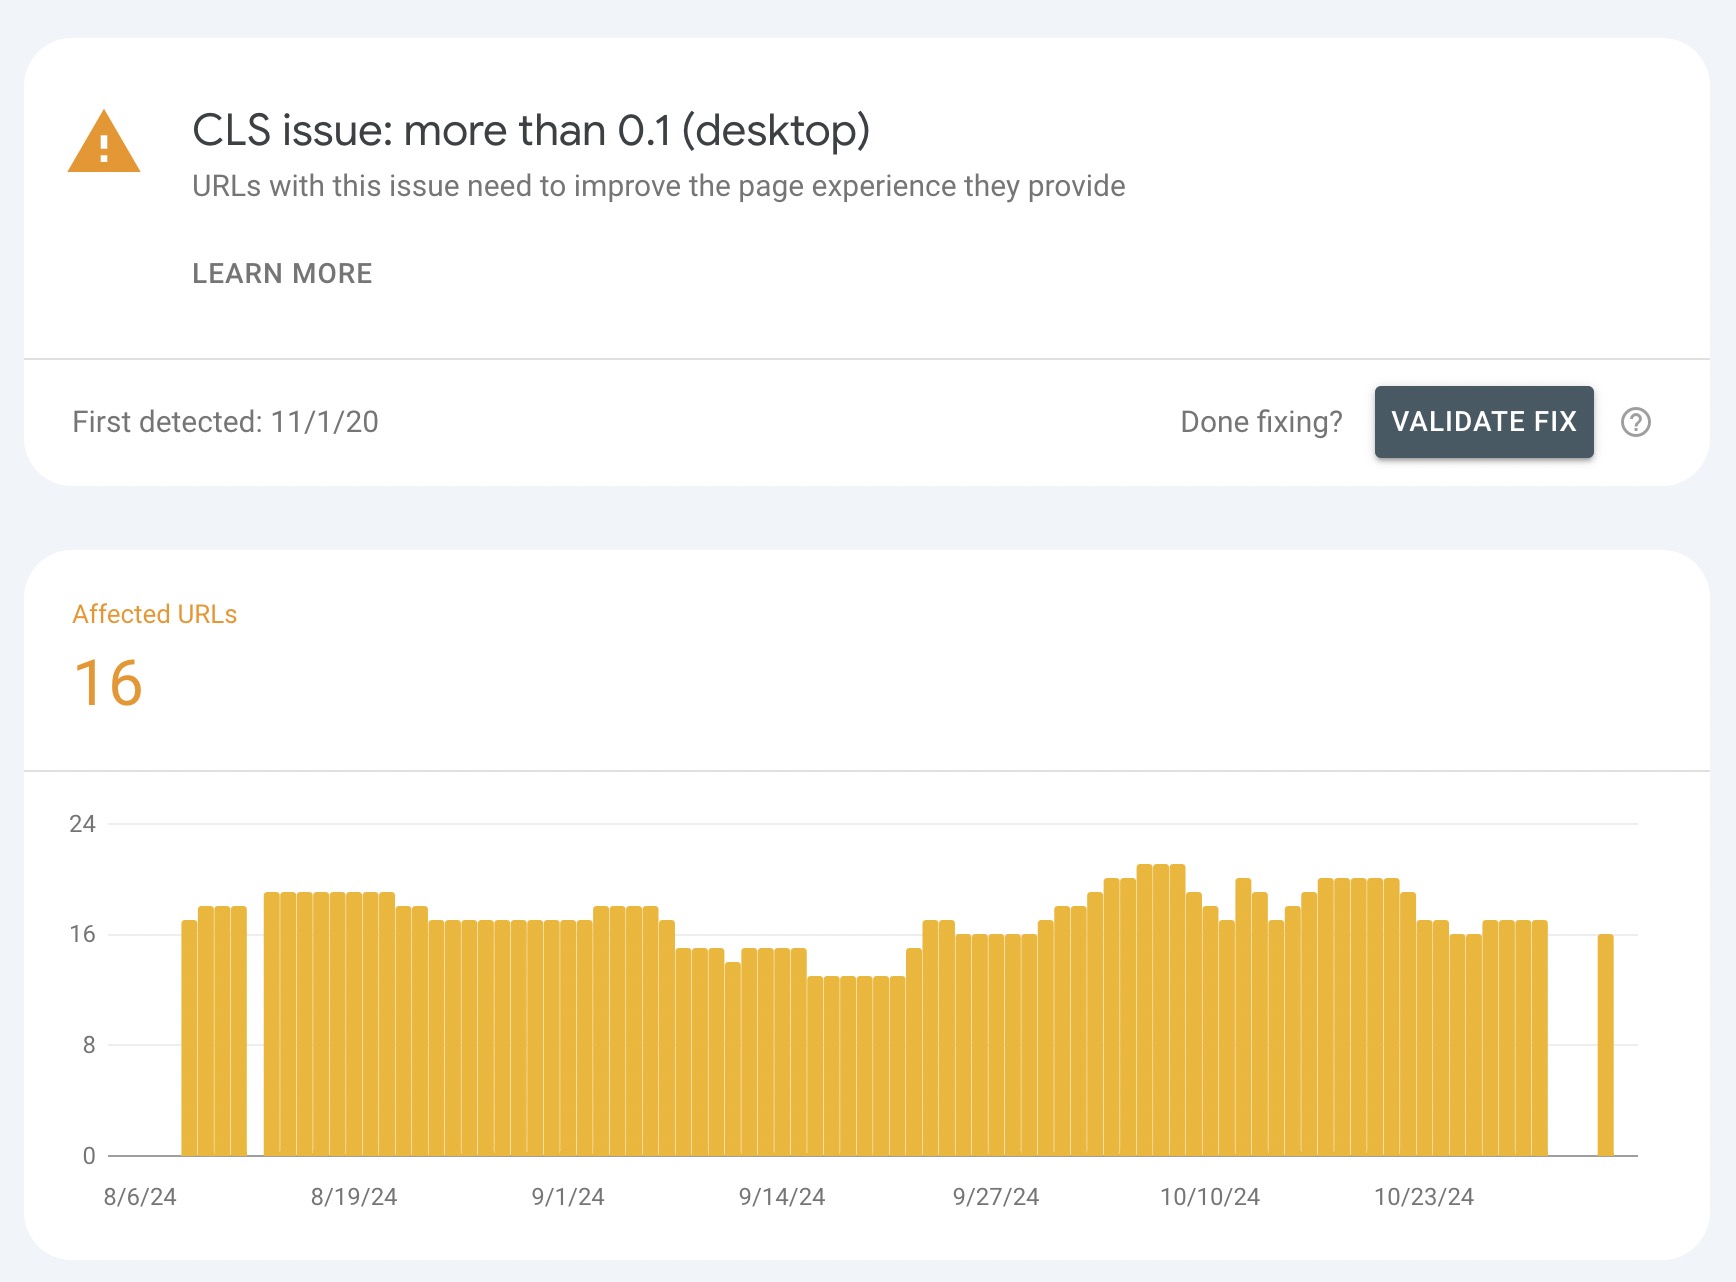
3. Google Search Console
From the website owner’s perspective, the appearance of Core Web Vitals data in Google Search Console seems to be the most useful. Under the Enhancements > Core Web Vitals section, results of LCP, INP, and CLS field data are shown.
Additionally, users have started receiving notifications from Search Console recently if there’s an issue with these metrics.
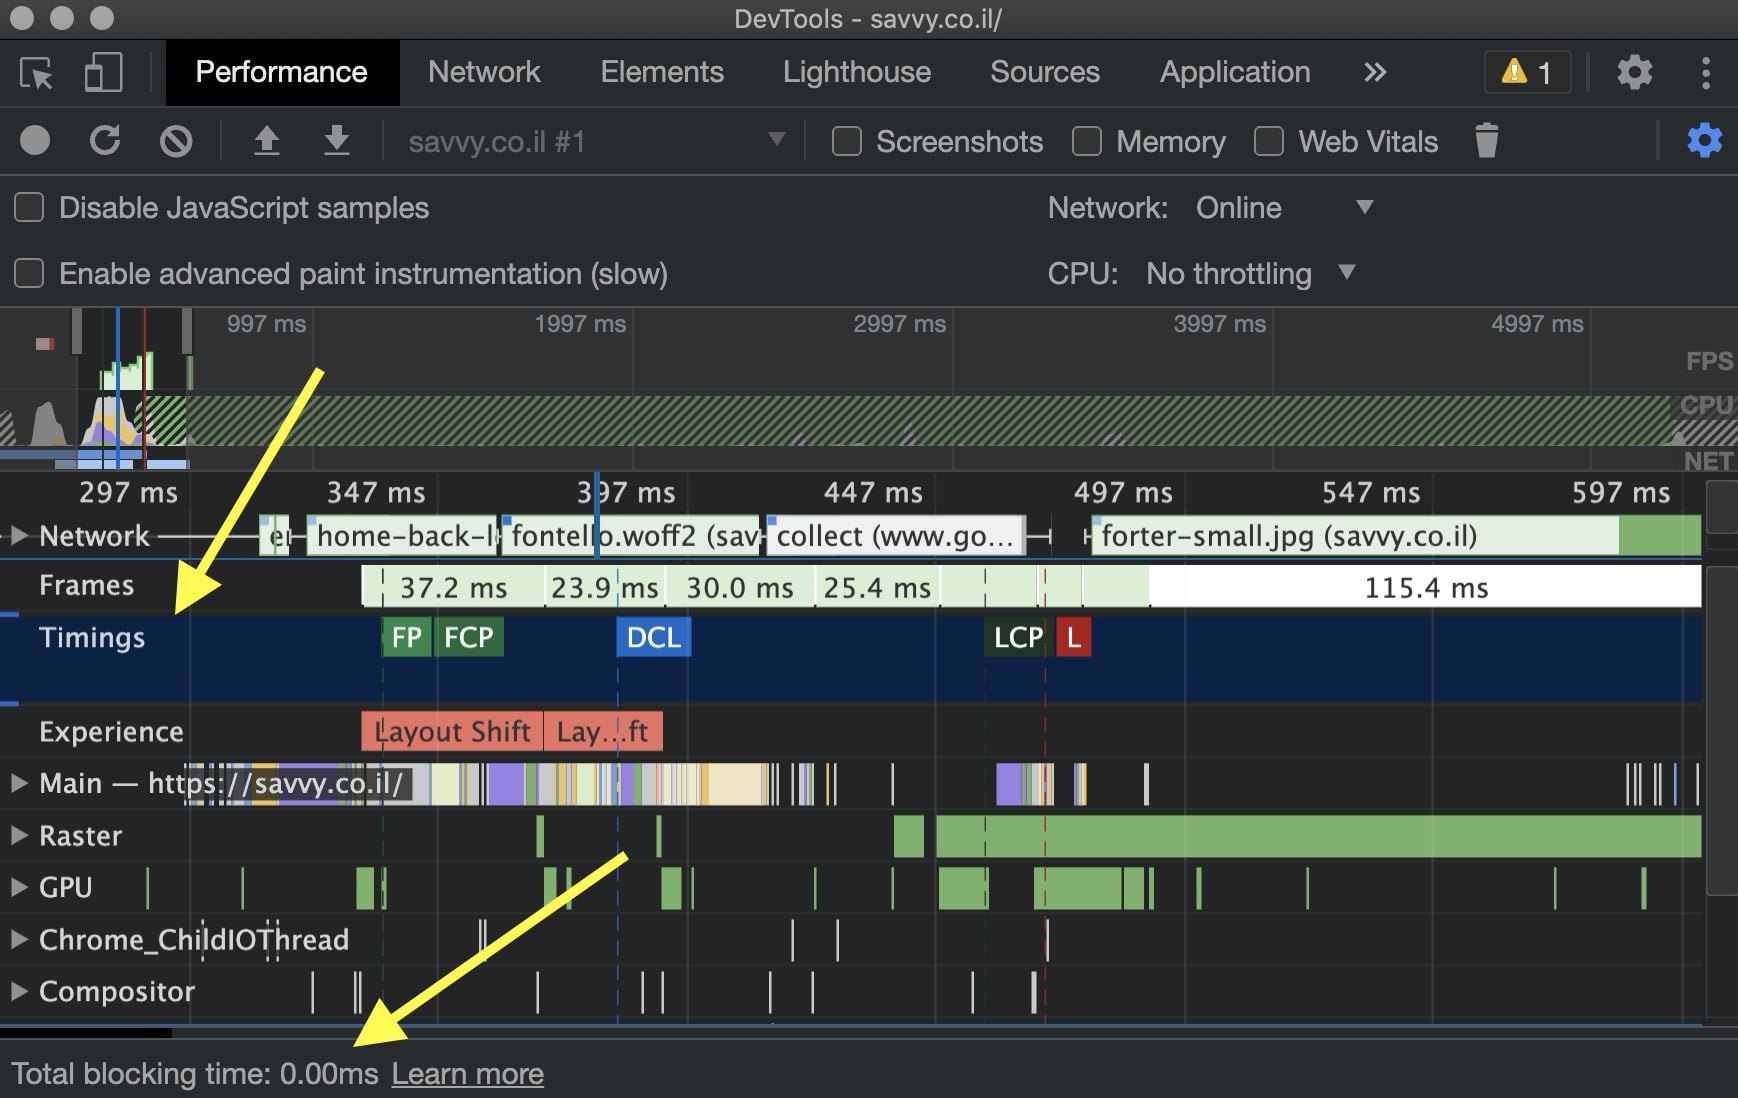
4. Chrome Developer Tools
In Chrome’s developer tools, you can check the Core Web Vitals in the Performance tab. There, you’ll get detailed information about the site’s performance, including those mentioned metrics. In the Experience section, you’ll find information about layout shifts (CLS), and in the Timing section, you’ll find the LCP value.
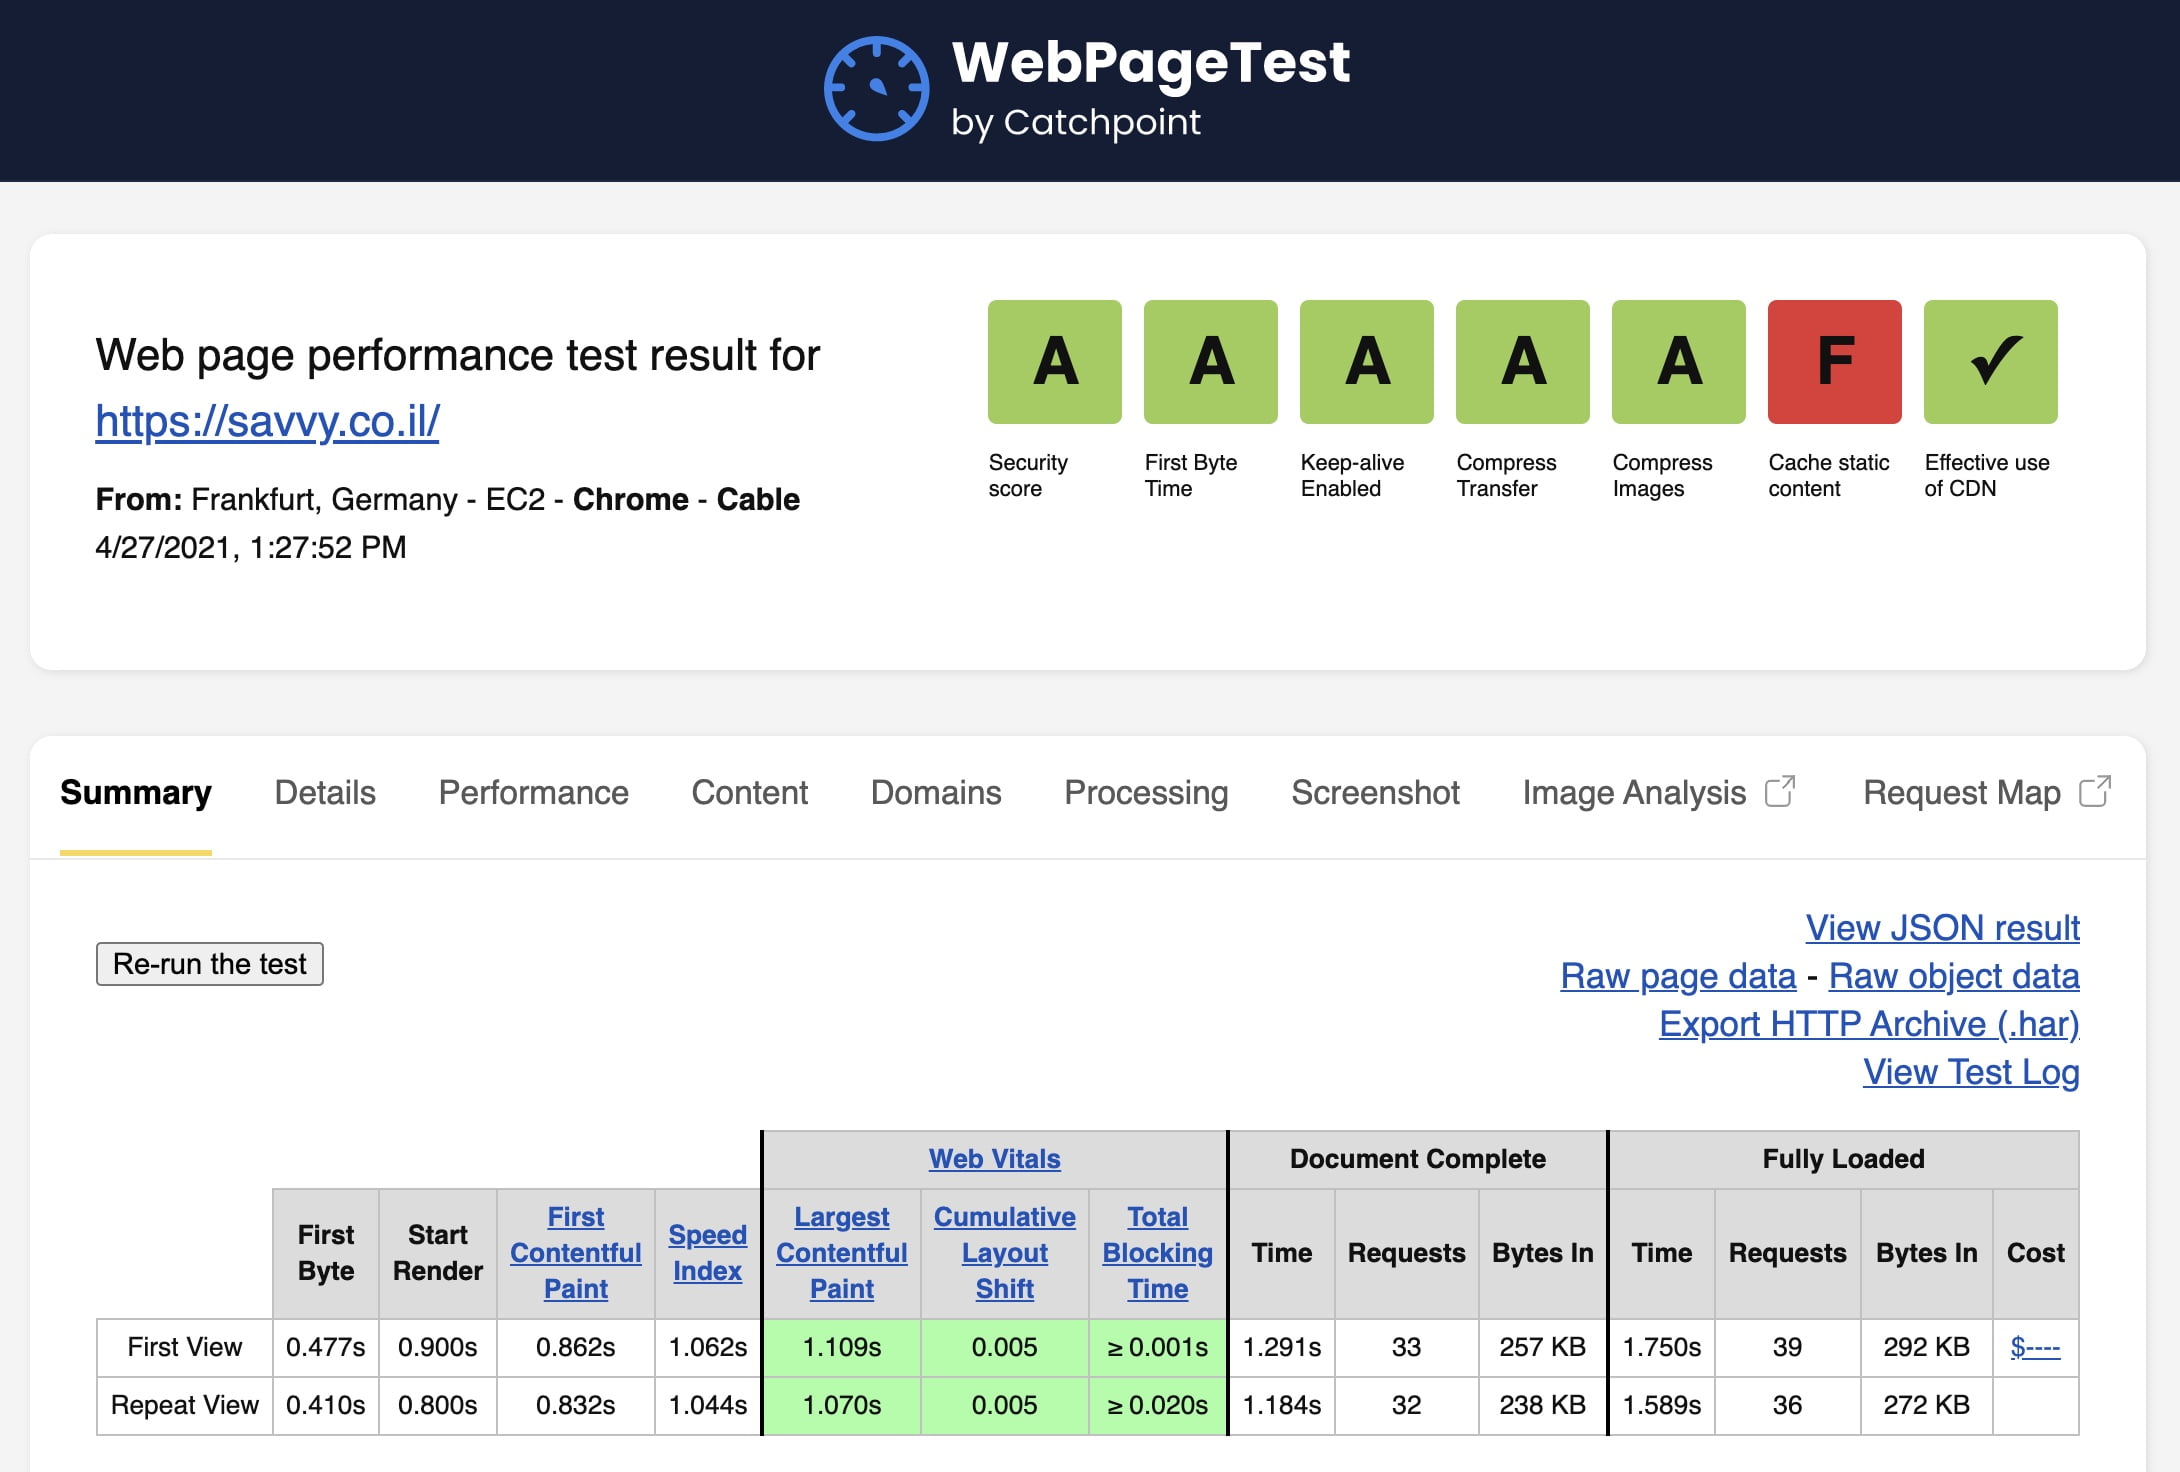
5. WebPageTest (WEB)
The best standalone tool for website performance testing is WebPageTest, acquired by Catchpoint in late 2020, and it started showing your Core Web Vitals data.
Besides displaying LCP, TBT, and CLS metrics, the tool provides a Filmstrip view, allowing you to observe a summarized animation of page loading with the option to highlight sudden layout changes.
I wrote a separate post about the amazing tool called WebPageTest. Take a look…
Summary
Core Web Vitals have become an established part of how Google evaluates websites. Since their introduction as ranking signals in 2021, the metrics have evolved – most notably with INP replacing FID in March 2024 as a more comprehensive measure of interactivity.
Whether you focus on LCP, INP, or CLS, the goal remains the same: deliver a fast, responsive, and visually stable experience for your visitors. The tools covered in this guide give you everything you need to measure, monitor, and improve these metrics.
If you know of other tools that help with measuring Core Web Vitals, feel free to share in the comments. Page speed also affects AI crawlers – slow pages get less thorough processing. Check your TTFB and other AI signals with the AI Visibility Audit.