Every SEO guy knows that site performance and user experience play a crucial role in search engine rankings and conversion rates.
Just as there are tools for keyword analysis, ranking checks, and link monitoring, there are also excellent tools that help you optimize and improve your site’s speed.
In this guide, we’ll take a look at a tool called WebPageTest, which is undoubtedly the best free tool for testing your site’s speed and performance, surpassing many other popular tools in the market.
What Does WebPageTest Do?
WebPageTest essentially tests how a specific page loads. Once the page is loaded, various important metrics are captured and cataloged. These metrics are then presented to you in the form of charts, graphs, and tables that help analyze problems and delays in page loading.
The tool was originally created by Patrick Meenan at AOL in 2018 and is now funded by Google as part of the effort to improve web speed.
You have control over many aspects of the analysis that WPT performs. For example, you can choose the platform (desktop/mobile), the device for testing, the browser (Chrome, Firefox, Explorer), and even the geographical location from which the test will be conducted.
However, what we’ve mentioned here is just a fraction of the capabilities of this tool. WebPageTest can do much more, so much that even a book with over 200 pages has been written about it. Nonetheless, even without reading any book, you can utilize the tool for optimization and improvement of your site’s performance.
Why is WebPageTest Preferred Over GTmetrix and Pingdom for Speed and Performance Testing?
Many of you perform speed tests using tools like GTmetrix and Pingdom. These tools are nice and may even look visually better than WebPageTest, but they are not as accurate for several reasons (at least at the time of writing this post):
- WPT offers a wider range of connection throttling options.
- Only WPT and GTmetrix support HTTP/2.
- The browser versions used by these tools are much older than the version used by WebPageTest. For example, WPT uses Chrome 69 while GTmetrix uses Chrome version 62 and Pingdom lags further behind with Chrome version 39, which doesn’t support the HTTP/2 protocol at all.
You can see the versions these tools use by looking at the
User-Agentunder Request Headers in the test results (see images).

User Agent – Pingdom

User Agent – GTmetrix

User Agent – WebPageTest
Testing Your Site’s Speed with WebPageTest
Let’s see an example, and maybe you’ll get familiar with WebPageTest. We are going to set up a few configurations to make sure WebPageTest collects and measures all the necessary information to answer important questions about our site’s performance and user experience.
As a start, go to www.WebPageTest.org and you’ll see something like this:
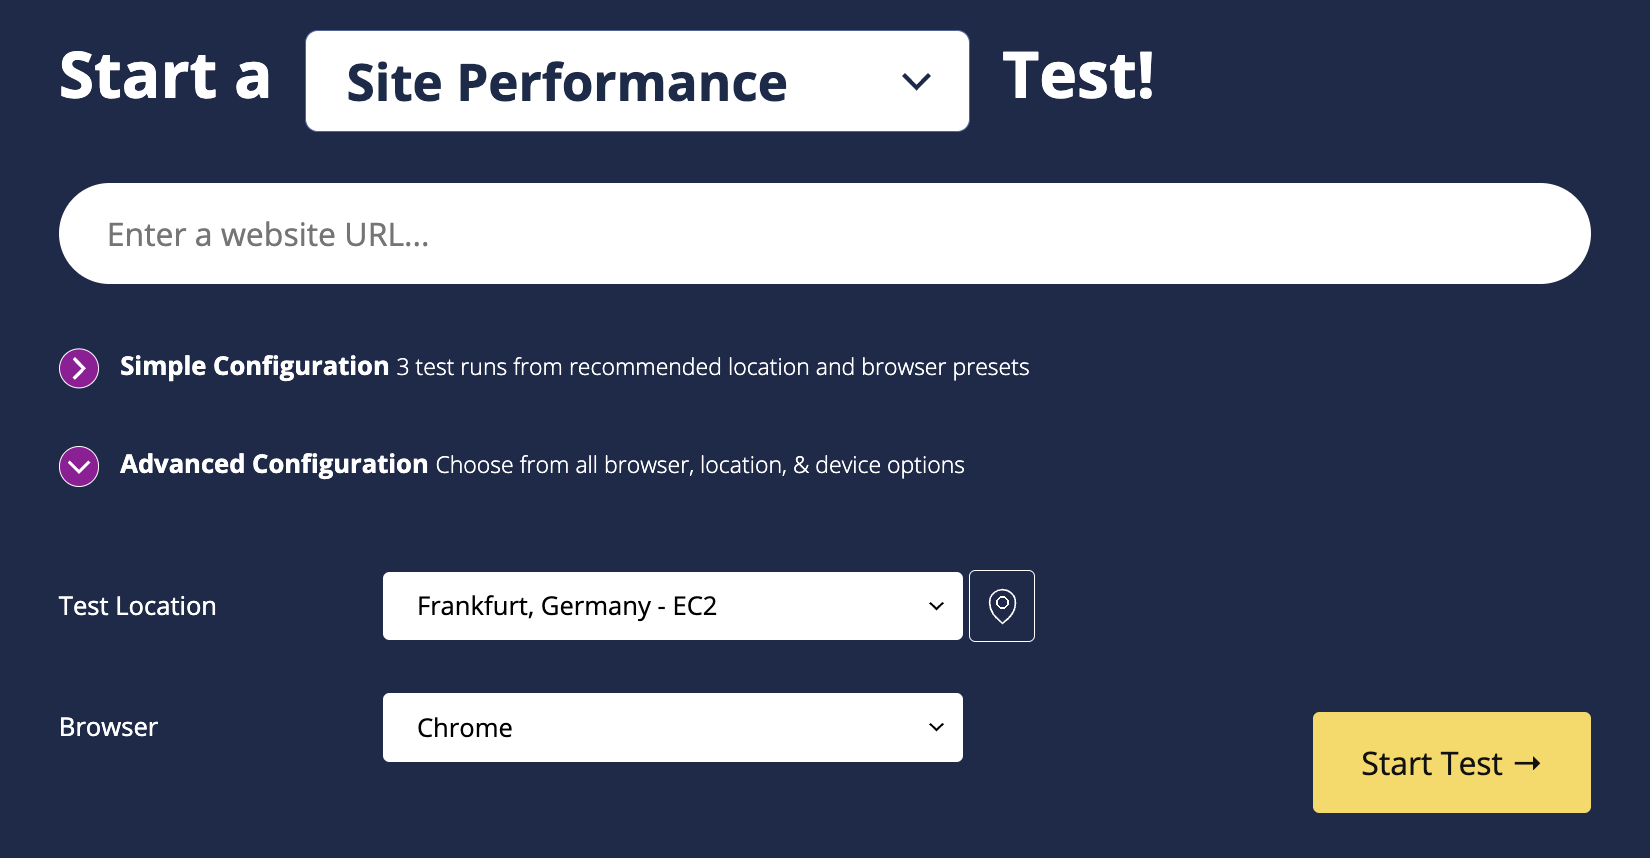
In this window, you’ll find two options:
Test Location – The Location from Which the Test Will Be Conducted: Under this option, you’ll find over 40 different geographic locations where you can conduct the test. Through partnerships, WPT is physically present on servers in these locations.
When you enter the URL of a specific page for testing, the server in the chosen location will load this URL locally with the browser you’ve selected.
This is obvious, but the speed and reliability of your test depend on the servers used for testing, and you’ll likely get different results from different locations. Additionally, not all servers support all the options the tool offers.
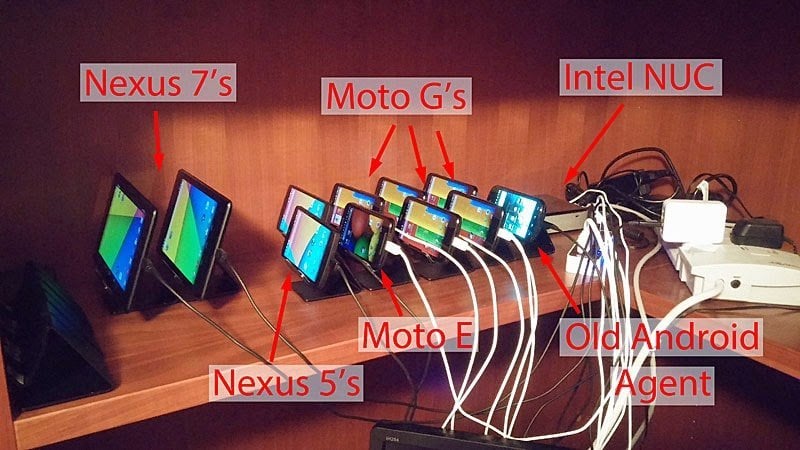
Browser – The Browser Used for Testing: Under this option, you’ll find several configurations from which you can choose for testing. Note that unless specified, mobile tests are performed from actual mobile devices and not emulators. Patrick Meenan shared an image of such a configuration in his blog.
Keep the default browser (Chrome) and click on Advanced Settings. Let’s discuss some of the options in this window…
Advanced Settings Window
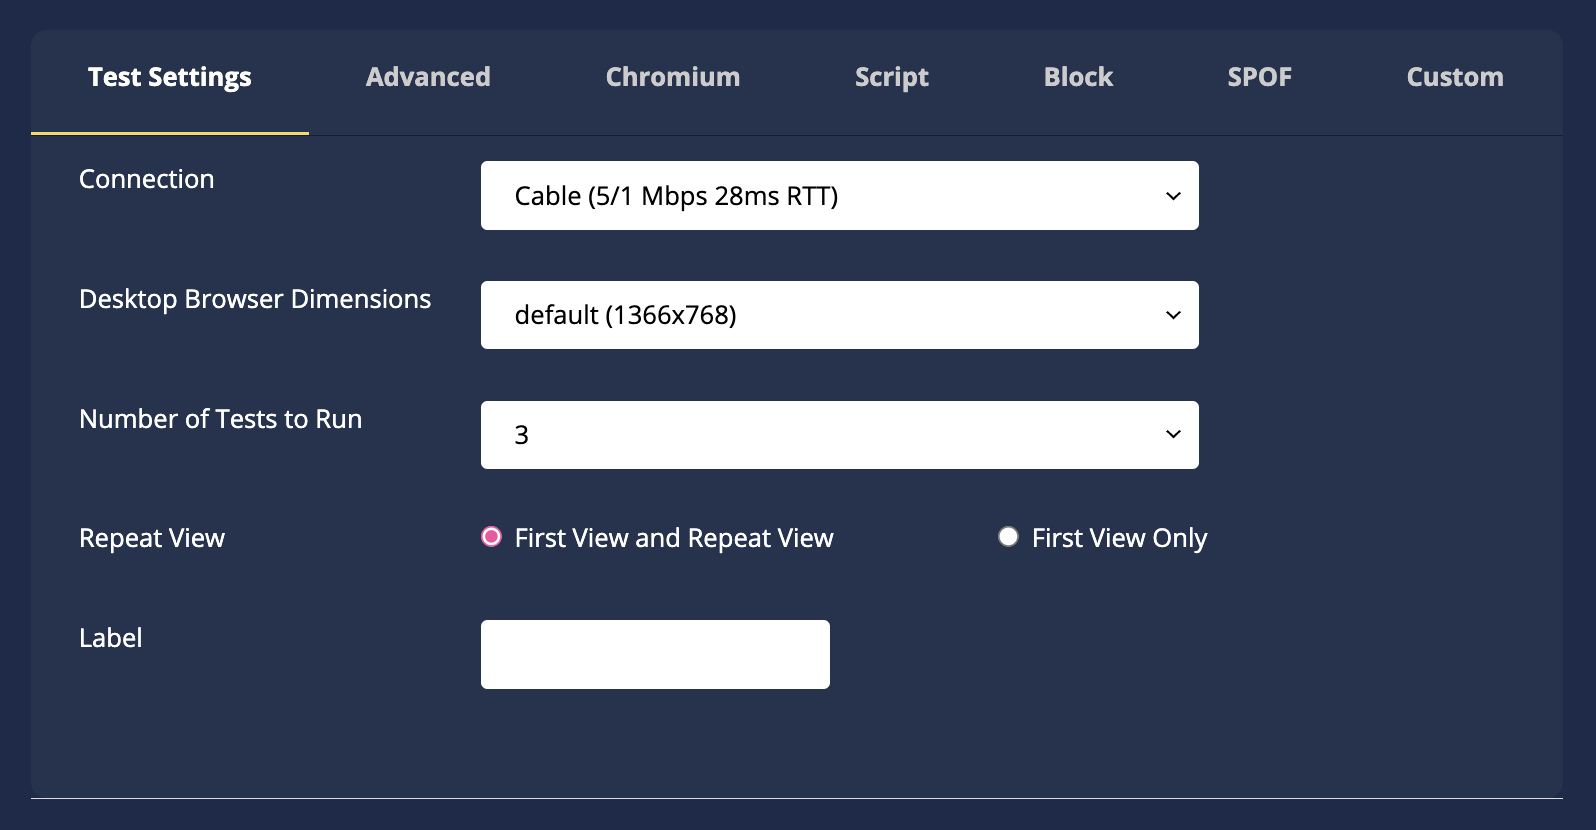
A. Connection:
Simulates the connection speed. Not very relevant at the moment unless you’re performing more advanced tests. Keep it at the default Cable 5/1 Mbps 28ms RTT.
B. Number of Tests
As the name implies, this option controls the number of repeated tests. To get reliable results, it’s a good idea to perform the test several times and let WPT choose the median result. It’s recommended to set this option to at least 3 tests.
C. Repeat Views – Repeated Test
This option determines whether each test should be performed once (when there is no cache memory) or alternatively, once when the cache is cleared and then a test when it exists.
Why is it important? When the browser loads a specific address for the first time, there are almost always JavaScript files, images, and other assets that need to be downloaded to display the page. When the browser fetches these files, it (according to your server settings) stores them locally in the cache memory for subsequent visits to pages on your site.
This explains why almost always your first visit to a specific site is slower than the next time you enter the same site. I recommend changing this setting to First View and Repeat View so that you can understand the experiences of new visitors as well as the experience for those who have already visited your site.
Leave the rest of the options in their default state. Enter the website address you want to test and click Start Test. Usually, it takes 30-60 seconds to get a result, depending on the options you’ve chosen and how many people are waiting in line 🙂
Now, let’s take a look at the results…
WebPageTest Results Analysis
After the test is completed, you’ll find that you have received a lot of information, much more than I can cover in the scope of this guide. Let’s focus on the key points for now.
The first thing you’ll notice in the upper-right part of the screen is a set of indicators about the most critical performance issues.
These cover a number of basic optimizations relevant to each site, and any score that is not an A or B justifies further investigation. I won’t go into detail about these topics as you will find solutions for all of them in the performance improvement guide for WordPress sites.
Test Results – Performance Results
We will focus on the numbers and metrics under the title Performance Results – Median Run. These are essentially the most important metrics to consider.
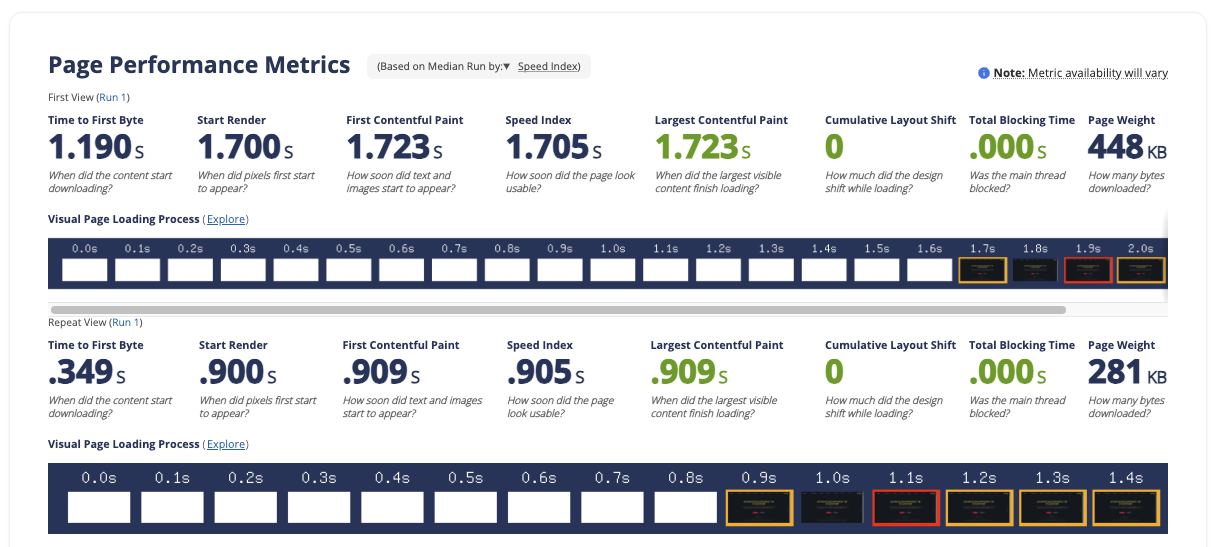
So as we mentioned before, this is the average result of 3 tests. In this section, you’ll see the result of the initial load and also the result of the repeat load (when the assets are in the cache memory).
In general, it can be said that the repeat load result will always be faster than the initial load result. If this is not the case, there might be some issue with the cache mechanism on your site. Let’s go over these metrics:
- First Byte – This is the First Byte Time or TTFB (a significant metric that I will explain in more detail later). Essentially, it’s the time it takes to receive the first byte of the HTML Document, and it’s usually relatively low compared to the overall page load time. Images, JavaScript files, and assets in general are the ones that take the most time to load. Your goal is to achieve a First Byte Time between 200-400ms.
- Start Render – This is the time it takes until something becomes visually visible on the screen beyond the white screen.
- DC Time – This is the time when all initial components in the HTML DOM are loaded and you can start interacting with the page (such as scrolling, etc.).
- Fully Loaded – This is the point in time when the loading is completed. All assets, tracking codes, and more. Many sites aim to have the DC Time (previous item) improved at the expense of the time it takes for the page to be fully loaded (Fully Loaded). In other words, to continue loading things in the background as long as the user can interact with the page.
- Speed Index – This metric is unique to WPT and measures how quickly the content of the site “paints” visually. The calculation formula is quite interesting, and you’re welcome to read more about it in the WPT documentation. It’s safe to say that the lower this value, the faster your page is loading visually.
- DC Requests – The number of requests made to the server by the browser to fetch the content of the page (images, JS, CSS, etc.).
- DC Bytes – The amount of data (in bytes) that the browser had to download to load the page. This metric is usually referred to as “Page Size”.
- For data on FCP, CLS & LCP, you can read in the post I wrote about Core Web Vitals.
The general goal of site optimization is to have all these metrics we mentioned in this section lower.
Appendix – Time to First Byte
Before we continue, I want to say a few words about Time for First Byte (TTFB) as it seems that there is a fairly clear correlation between this metric and site ranking on search engines, as shown in the image below. It appears that sites received a lower ranking when the TTFB was lower.
Here is the translated text while leaving the HTML untouched:
So this data is the measure of how fast the network and server returned the first byte of the requested HTML file. The lower this data is, the better, indicating that the site responds faster. A high TTFB can indicate a particularly weak server.
Waterfall Charts
One of the most useful options in WPT is Waterfall Charts. In a few words, a Waterfall Chart is a diagram that presents which assets were loaded by the browser in order to render the page.
The horizontal axis refers to the loading time of the assets and the vertical axis refers to the chronological order in which the assets were loaded (from top to bottom).
Additionally, each row in the chart is colored with various colors that describe different loading and rendering actions performed by the browser to load the same asset, for example:
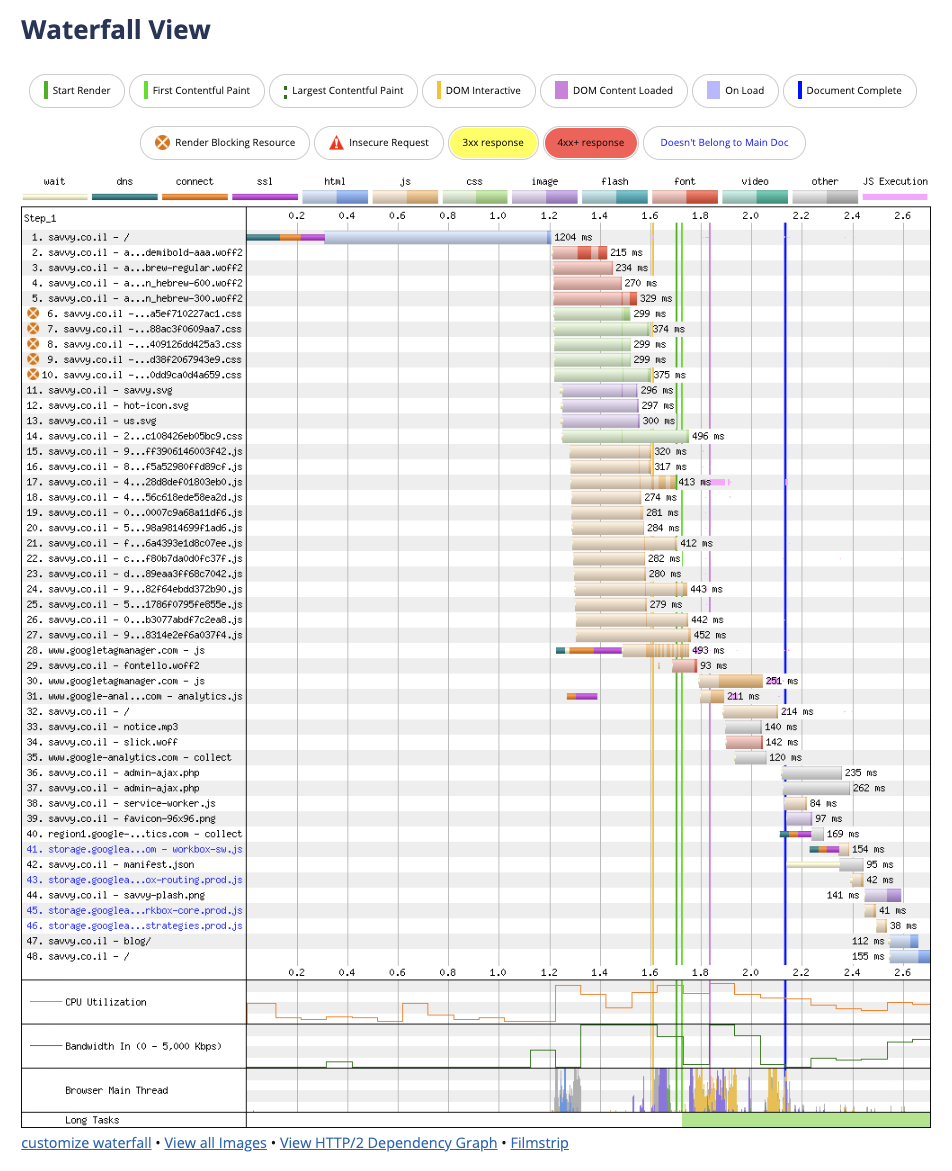
Using Waterfall Charts is very helpful when you want to identify the bottleneck causing your page to load slowly. The wider the chart (primarily the individual segments), the longer it takes for your page to load.
The longer the chart, the more assets are loaded. You can infer from this that your goal is to minimize the length and width of the chart.
Much more information can be derived from Waterfall Charts, and analyzing this chart is a topic in itself with a lot of nuances, requiring a separate post about it.
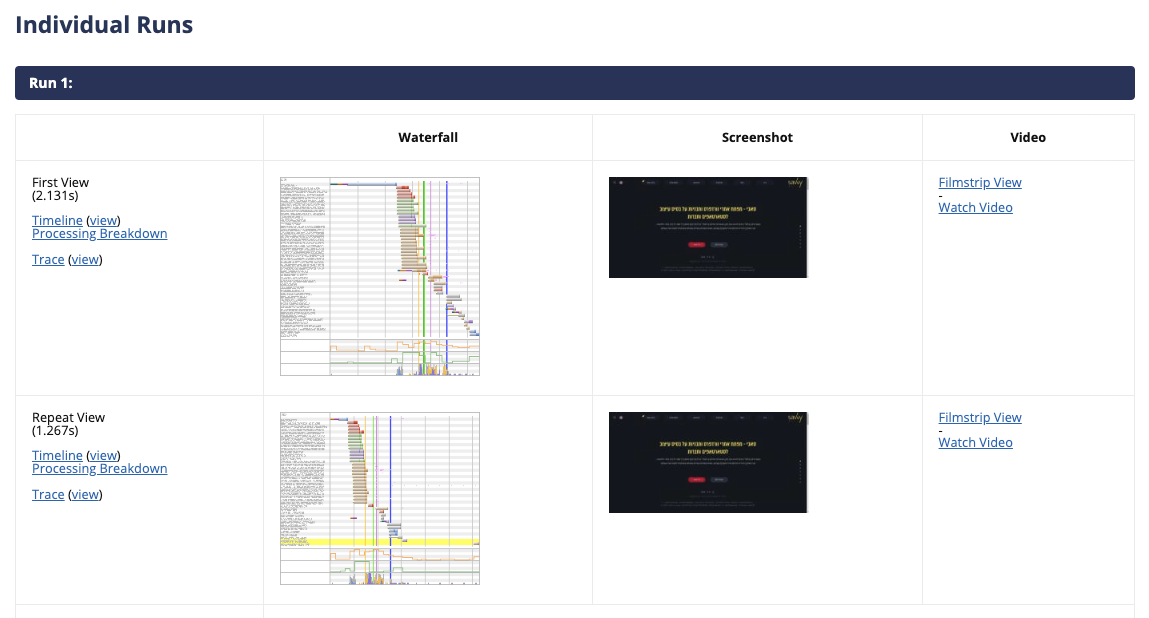
Visual Insight into How Your Site Loads
In addition to capturing videos that show exactly how the user will see your site load, and this information is very useful.
For example, even if you’re working from Croatia with a Nexus 7 device, you can still see how this user’s experience will look.
To view the video, go to Individual Runs in the test results and then click on the Watch Video link in the right column:

If your site’s TTFB is slow, there will be a significant delay before any element appears in the video. Beyond that, the video can provide a perspective on the time it takes for an element to appear on the screen for the user.
In Conclusion
You can spend more hours exploring the advanced options and features of WebPageTest. In fact, the tool’s developer even has an interesting lecture (for advanced users only) about the tool, and you are invited to take a look at the video below and the second part of the lecture in this link.
I conclude by saying that WebPageTest is a tool that is difficult to live without, especially for optimization and website speed enthusiasts.
It allows you to find and debug loading issues on your site, and by fixing these issues, you can achieve higher rankings in search engines and a better and more accurate user experience.
I hope that this overview of WebPageTest provides a good enough foundation for you to start delving into optimizing your site, whether it’s a WordPress site or not.
Comments and questions are welcome…. 🙂

