This is Part 2 of the guide to Google PageSpeed Insights, and perhaps the more interesting part for many of you. In the previous part of the guide, we covered the lab data that Google PageSpeed Insights displays.
In this part, you will learn how to actually improve those scores and lab metrics that PSI shows you. We will go over whether and how to fix the recommendations that PageSpeed displays. In general, we will explain these recommendations in simple terms and clarify how to interpret them, especially for non-technical WordPress site owners.
Important: In October 2025, Google released Lighthouse 13, which replaced the old Opportunities and Diagnostics format with a new “Insights” section. Several individual audits have been consolidated into broader insights (for example, four separate image audits are now a single “Improve image delivery” insight). The underlying optimization advice is the same, but the report looks different. This guide has been updated to reflect the new format.
How the Report Works in Lighthouse 13
With Lighthouse 13, PageSpeed Insights no longer shows the familiar “Opportunities” and “Diagnostics” split. Instead, the report is organized into two new sections:
Insights – consolidated recommendations that group related issues together (for example, all image-related problems appear under a single “Improve image delivery” insight). Each insight is marked with a red triangle, orange square, or gray circle based on severity, and many include estimated savings.
Diagnostics – additional information about performance that does not directly map to an insight. These include items like “Reduce unused CSS,” “Reduce unused JavaScript,” and “Avoid long main-thread tasks.”
")
Remember! The ultimate goal is not to improve the score itself, but to improve the user experience that comes from faster site loading and displaying the main content to the visitor as quickly as possible.
I will try to cover each recommendation. Throughout this guide, I may use the term PSI, which is short for PageSpeed Insights, for convenience 🙂
Insights – The New Consolidated Recommendations
The Insights section is the main place you will look for actionable recommendations. Several old audits have been merged into single insights, which makes the report easier to read. Here is what you need to know about each one.
1. Reduce Its Latency (Document Latency Insight)
In Lighthouse 13, three previously separate audits – “Avoid Multiple Page Redirects,” “Reduce Server Response Time,” and “Enable Text Compression” – are now grouped under a single insight called “Reduce its latency.”
This insight covers everything that adds delay before the browser can start rendering the page. If your URL performs multiple redirects, your server responds slowly (high TTFB), or your files are not compressed, you will see this insight flagged.
Redirects: Make sure you always test the correct version of your URL. If your site uses HTTPS and does not use www, test that exact URL. Multiple redirects (e.g. HTTP to HTTPS and then www to non-www) add up quickly.
You may find additional relevant information in the post about how to migrate a WordPress site to HTTPS.
Server Response Time (TTFB): The faster your server responds, the sooner the page becomes available to the visitor. For WordPress sites, the main causes of slow TTFB are:
- No caching is in place, or it is configured incorrectly.
- A low-quality hosting provider (check out the hosting I recommend – I promise you will see better results).
- Plugins that cause issues and slow down server response time.
- A bloated database.
If you are using a cache plugin and still see this recommendation, try running PSI again in case the first test hit a page that was not yet cached. If you do not have server-level caching, install a cache plugin such as WP-Rocket or Total Cache.
Text Compression: Whether through gzip or brotli, compression reduces file sizes as they travel from the server to the browser. This is a fundamental feature, and most cache plugins will add the relevant rules to your htaccess file automatically. If your server does not support compression, it is time to switch hosting providers.
Read the extended post about the impact of TTFB on website speed and the ways to improve this metric.
2. Improve Image Delivery
In Lighthouse 13, four previously separate audits – “Properly Size Images,” “Efficiently Encode Images,” “Serve Images in Next-Gen Formats,” and “Use Video Formats for Animated Content” – are now grouped under a single insight called “Improve image delivery.”
This insight flags any image on the page that is larger than necessary, not properly compressed, or served in an older format. When you expand it, you will see a table listing each flagged image with its resource size and estimated savings.

Image sizing: Make sure you upload images at the correct dimensions. If a product image displays at 400×400 but the actual file is 700×700, the browser does extra work to resize it – and your site sends unnecessary data.
For more information and how to define new image sizes in your theme, check out the post on image sizes in WordPress.
Image compression: Heavy images are one of the main causes of slow pages. Pay attention to the number of bytes you can save. If you have not properly optimized your site’s images, this insight will likely appear.
Note that PSI will flag all images on the page, including those from third-party scripts (e.g. Instagram embeds). You cannot optimize those since you have no control over them.
Modern formats: Today all modern browsers support both WebP and AVIF. Plugins such as Imagify, ShortPixel, or LiteSpeed Cache can convert your images automatically. AVIF provides even better compression than WebP at high quality.
Animated content: GIF files are not efficient for displaying animations. Consider converting them to CSS animations, SVG, or video. There are free online services that convert GIF to video quickly.
Note: The old “Defer Off-Screen Images” audit has been removed in Lighthouse 13. Modern browsers already deprioritize offscreen images, so while lazy loading still helps reduce bandwidth, Lighthouse no longer flags it as an issue. WordPress 5.5+ automatically adds loading="lazy" to images, and plugins like WP-Rocket and LiteSpeed Cache provide more advanced lazy loading for videos and iframes.
3. Minify Resources – HTML, JS, CSS
Minification is the process of reducing file size by removing whitespace and comments from HTML, CSS, and JavaScript files using various techniques. This reduces file weight and theoretically makes downloading these files faster.
In practice, the data savings from minification are often negligible and unlikely to have a noticeable impact on your site’s load time. Check the potential savings for these files after minification. If the savings are not significant, do not worry about it.
As with minification, you cannot control third-party files that are not hosted on your server.
How to address this recommendation?
The solution is simple, and many plugins can handle minification for you, especially cache plugins. So why not do it? Just be aware that in some cases, minification can break functionality on your site.
4. Network Dependency Tree
In Lighthouse 13, the old “Preconnect to Required Origins” and “Minimize Critical Request Depth” audits are now combined into the “Network dependency tree” insight.
This insight shows how your page’s network requests depend on each other. Every additional DNS connection to a third-party domain takes time. You can use dns-prefetch or preconnect, which I wrote about in detail, to have the browser start connecting to those domains earlier.
Cache plugins can handle preconnect for you, or you can add it through code. Keep in mind that the real solution is to use as few third-party assets as possible – preconnect is a band-aid.
Here is an example of using preconnect for early loading of Google Fonts:
<link href='https://fonts.gstatic.com' rel='preconnect' crossorigin>
<link href="https://fonts.googleapis.com/css?family=Assistant:300,400,700,800" rel="stylesheet">
The above-the-fold portion of the page – the part users see first – is affected by how requests chain together. You need to make sure the critical part of the page renders as quickly as possible by prioritizing truly needed files and deferring the rest using async and defer.
Coffee break 🙂 Now you should know that the next recommendations I will present are aimed at combating the negative effects of overly complex page construction.
5. Render Blocking Requests
In Lighthouse 13, this audit is now called “Render blocking requests.” The concept has not changed – it identifies CSS and JavaScript files that block the browser from rendering the page.

When the browser encounters a CSS or JS file, it stops, processes the file, and only then continues rendering. That pause is called render blocking. To avoid it, you can load these files in a non-blocking way using techniques called “defer” and “async.”
If you want to learn more, check out the post on deferring JavaScript, and the post on creating Critical CSS and fixing render-blocking resources.
Should you fix this?
Definitely. Most cache plugins will handle it for you. They allow you to apply defer and async to render-blocking files and even generate the Critical CSS for the above-the-fold portion of the page.
Make sure to test your site after applying these techniques, as they can break functionality on your site.
6. Font Display
Previously called “Ensure Text Remains Visible During Webfont Load,” this insight is now simply called “Font display.” It applies to any web font you load, whether through Google Fonts, TypeKit, or via @font-face.
Since web fonts take time to load, there is a period during which no text is visible. The fix is to display a basic system font during that time using the font-display property. I discussed this in detail in the post about the font-display property.
If you want to fix this, use font-display: fallback or font-display: swap for every font you load.
7. Use Efficient Cache Lifetimes
Previously called “Serve Static Assets With an Efficient Cache Policy,” this insight is now called “Use efficient cache lifetimes.”
Browser caching stores files in the browser’s memory, which significantly improves performance on return visits. Most servers support this by default, but you can fine-tune settings like how long files are cached and which files are included.
If the flagged files are served from your domain, you should fix this. Most cache plugins will handle it automatically. As with other recommendations, you can only control files served from your own server, not third-party files.
Check out the post on how to improve WordPress loading time. It is the most viewed post on this blog, and you will find many settings and optimizations that PageSpeed Insights does not flag.
8. Layout Shift Culprits
This is a new consolidated insight in Lighthouse 13 that groups together the old “Avoid Non-Composited Animations” and “Unsized Images” audits. It helps you understand what causes Cumulative Layout Shift (CLS) on your page.
If you see this insight, it means elements on your page are shifting positions during load. Common causes include images without explicit width and height, dynamically injected content, and animations that trigger layout recalculations.
9. 3rd Parties
Previously called “Third-party Summary,” this insight is now simply called “3rd parties.” It lists all third-party scripts loaded on your page and their impact on performance.
The fewer third-party scripts you load, the faster your site will be. Review this list and ask yourself if every third-party service is truly necessary.
10. LCP Breakdown and LCP Request Discovery
These are two new insights in Lighthouse 13 that help you understand and optimize your Largest Contentful Paint (LCP). “LCP breakdown” shows how the LCP time is distributed across phases (server time, resource load time, render time). “LCP request discovery” helps you ensure the LCP resource is discovered early by the browser.
11. Forced Reflow
This is another new insight in Lighthouse 13. It identifies JavaScript code that forces the browser to recalculate layouts synchronously, which can cause jank and slow interactions. If you see this flagged, the page likely has JavaScript that reads and writes layout properties in a tight loop.
Diagnostics
The Diagnostics section in Lighthouse 13 contains additional audits that provide useful information but are not grouped into insights. Here is what you might see:
")
12. Reduce Unused CSS
Almost every WordPress site owner will see this diagnostic. Themes and plugins load CSS data even when it is not needed on a specific page, because they cater to many different display options and settings.
The chance of fully eliminating this recommendation is close to zero unless you develop the theme yourself. The impact of unused CSS is usually not dramatic, so I would suggest you address other items first.
If you want to try, check which CSS is unused through Chrome Developer Tools under the Coverage tab. Plugins like WP-Rocket offer a “Remove Unused CSS” feature, and LiteSpeed Cache offers “Unique CSS (UCSS).”
13. Reduce Unused JavaScript
Similar to unused CSS, this diagnostic flags JavaScript files that are loaded but not fully used on the page. Removing unnecessary JavaScript reduces download size and parsing time, which directly improves Time to Interactive and Total Blocking Time.
Review which plugins and scripts are loading on each page and consider using a plugin like Plugin Organizer or Asset CleanUp to selectively disable scripts on pages where they are not needed.
The next two diagnostics are related to the impact that JavaScript has on page performance. You need to know a bit about JavaScript to understand them. But first, let’s say a few words about the negative impact of JavaScript.
Appendix – The Negative Impact of JavaScript on Site Performance
Unlike HTML and CSS, which are the building blocks of a web page, JavaScript in most cases is not an essential component. JS is typically used to add interactive elements such as sliders, carousels, animations, video players, and so on.
If a lot of JavaScript is loaded on a specific page, it will slow that page down in most cases because:
- The browser has to download the JavaScript file.
- Parse the JavaScript (so the browser can read it).
- Execute the JavaScript in the browser.
Depending on the code itself and its purpose, the third step I mentioned will require significant time (in terms of site loading). Beyond that, the negative impact of JS grows exponentially on mobile devices because they have less processing power.
If you are not the one who wrote the JavaScript code, the only way to deal with its negative impact is to remove that code entirely.
Now that I have gotten that off my chest, let’s continue with the diagnostics that PageSpeed shows us…
14. Minimize Main-Thread Work
You will not find a better explanation of this recommendation than the one written by Addy Osmani (formerly Head of Developer Experience for Chrome at Google): JavaScript Start-up Optimization.
In a few words (that we may have already mentioned a few paragraphs ago), JavaScript has a high cost and it affects your site’s performance. You need to understand that the more JS is loaded, the longer it takes the browser to parse and execute it, and therefore the longer it takes before visitors can interact with your site.
Can you fix this?
Yes, by removing as much JavaScript as possible from your site. That means removing plugins and disabling interactive features in your theme or the Page Builder you are using.
15. Reduce JavaScript Execution Time
This diagnostic indicates that JavaScript execution on your site takes a long time. You may see it in the mobile report but not in the desktop report, because the processing power of computers and laptops is much greater than that of mobile devices.
Should you address this?
Yes. Remove as much non-essential JavaScript from your site as possible. Check whether there are JavaScript files that are not needed and find a way to remove them.
Removing and disabling the loading of JavaScript files is an excellent way to improve the Total Blocking Time (TBT) metric we discussed in Part 1 of this guide.
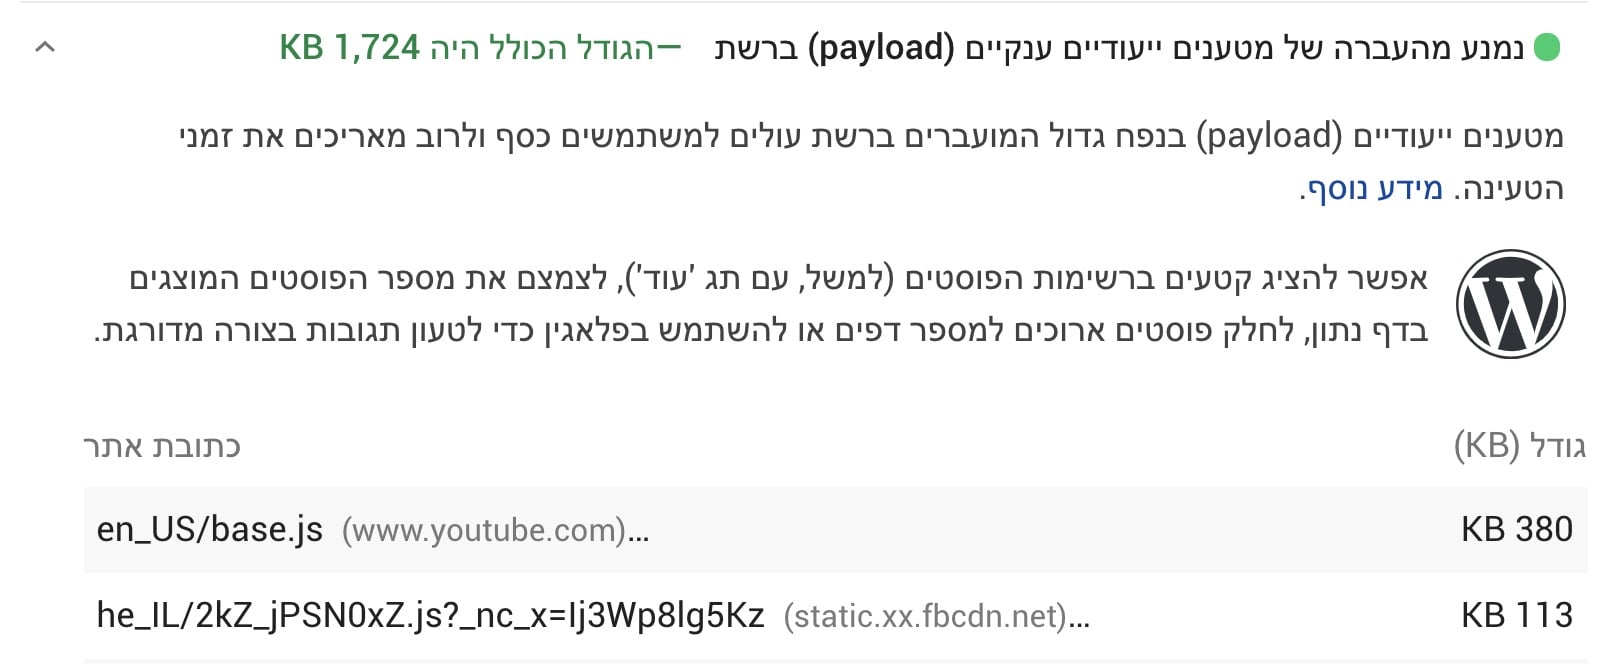
16. Avoid Enormous Network Payloads
This recommendation mainly refers to the overall size of the page. Page size is determined by all the individual files (assets) your site uses – images, CSS files, JS files, fonts, and so on.
Should you address this recommendation?
PageSpeed will show this recommendation if the total page size exceeds the recommended threshold (about 5MB). That said, try to aim for as low a size as possible – 1.5MB or less is a realistic target for most sites. This will have a significant impact on load speed, especially on mobile.
17. Optimize DOM Size
Previously called “Avoid Excessive DOM Size,” this diagnostic is now called “Optimize DOM size” in Lighthouse 13. The DOM (Document Object Model) is the structure of a page created from the code that renders it.
Every element you add to a page is another node. The more elements on the page, the more complex the DOM becomes, and the longer it takes the browser to build and render it.
Using premium themes and plugins, and especially Page Builders, increases the number of DOM nodes significantly.
Should you address this?
If you can, avoid building overly complex pages and avoid using Page Builders. This diagnostic is an indicator of overall page complexity. If you remove elements and simplify the page, it will improve.
Here is a post I wrote that goes into more detail about the Avoid Excessive DOM Size recommendation – check it out!
18. Avoid Long Main-Thread Tasks
This diagnostic (previously called “Avoid Long Tasks”) flags JavaScript tasks that take more than 50 milliseconds to execute, blocking the main thread and preventing the browser from responding to user input. This is closely related to the INP (Interaction to Next Paint) metric.
Core Web Vitals and PageSpeed Insights
It is important to note that since the original guide was written, Google introduced Core Web Vitals as part of its ranking formula. The three current metrics are:
- LCP (Largest Contentful Paint) – Measures how long it takes to display the largest element in the above-the-fold portion of the page. The recommended threshold is 2.5 seconds or less.
- INP (Interaction to Next Paint) – This metric replaced FID (First Input Delay) in March 2024 and measures the responsiveness of the page across all interactions. The recommended threshold is 200 milliseconds or less.
- CLS (Cumulative Layout Shift) – Measures the visual stability of the page. The recommended threshold is 0.1 or less.
These metrics affect your Google ranking and appear in the Field Data section of PageSpeed Insights. If you see those metrics in green, you are in good shape.
FAQs
Common questions about Google PageSpeed Insights:
Final Words on Google PageSpeed Insights
The average, non-technical WordPress site owner can definitely benefit from the report that PageSpeed Insights provides. However, it presents an oversimplified score through a number and a color, and the recommendations it shows are too technical for most users.
So you should use the data and recommendations from this tool alongside other performance testing tools to get the full picture of your site’s real-world performance.
Either way, I hope this guide shed some light on the report that PageSpeed provides. If you found it helpful, I would really appreciate it if you share this post or link to it – it takes many hours to write a post of this scope, and your feedback is what encourages me to keep writing…