AI coding assistants can write code but can’t see what happens in the browser. Chrome DevTools MCP (v0.19, March 2026) fixes that. It connects AI assistants to a live Chrome instance with 29 tools for Lighthouse audits, performance traces, network inspection, and accessibility debugging.
I pointed it at a production site and had scores, LCP breakdowns, and render-blocking analysis back in 30 seconds, without leaving my editor.
It works with Cursor, Claude Desktop, VS Code Copilot, Windsurf, Gemini CLI, and any MCP-compatible client.
Setting Up Chrome DevTools MCP
The setup takes two minutes regardless of which AI client you use. You need Node.js 20.19+ and Chrome stable installed, then add the server to your client’s MCP configuration.
The server entry is the same across all clients:
{
  "mcpServers": {
    "chrome-devtools": {
      "command": "npx",
      "args": ["-y", "chrome-devtools-mcp@latest"]
    }
  }
}
Where to add it depends on your client:
- Cursor:
~/.cursor/mcp.json(global) or.cursor/mcp.json(per-project) - VS Code (Copilot):
.vscode/mcp.jsonin your workspace - Claude Desktop:
- Mac:
~/Library/Application Support/Claude/claude_desktop_config.json - Windows:
%APPDATA%Claudeclaude_desktop_config.json
- Mac:
- Windsurf:
~/.codeium/windsurf/mcp_config.json
After saving, restart or reload your client. The server registers 29 tools automatically.
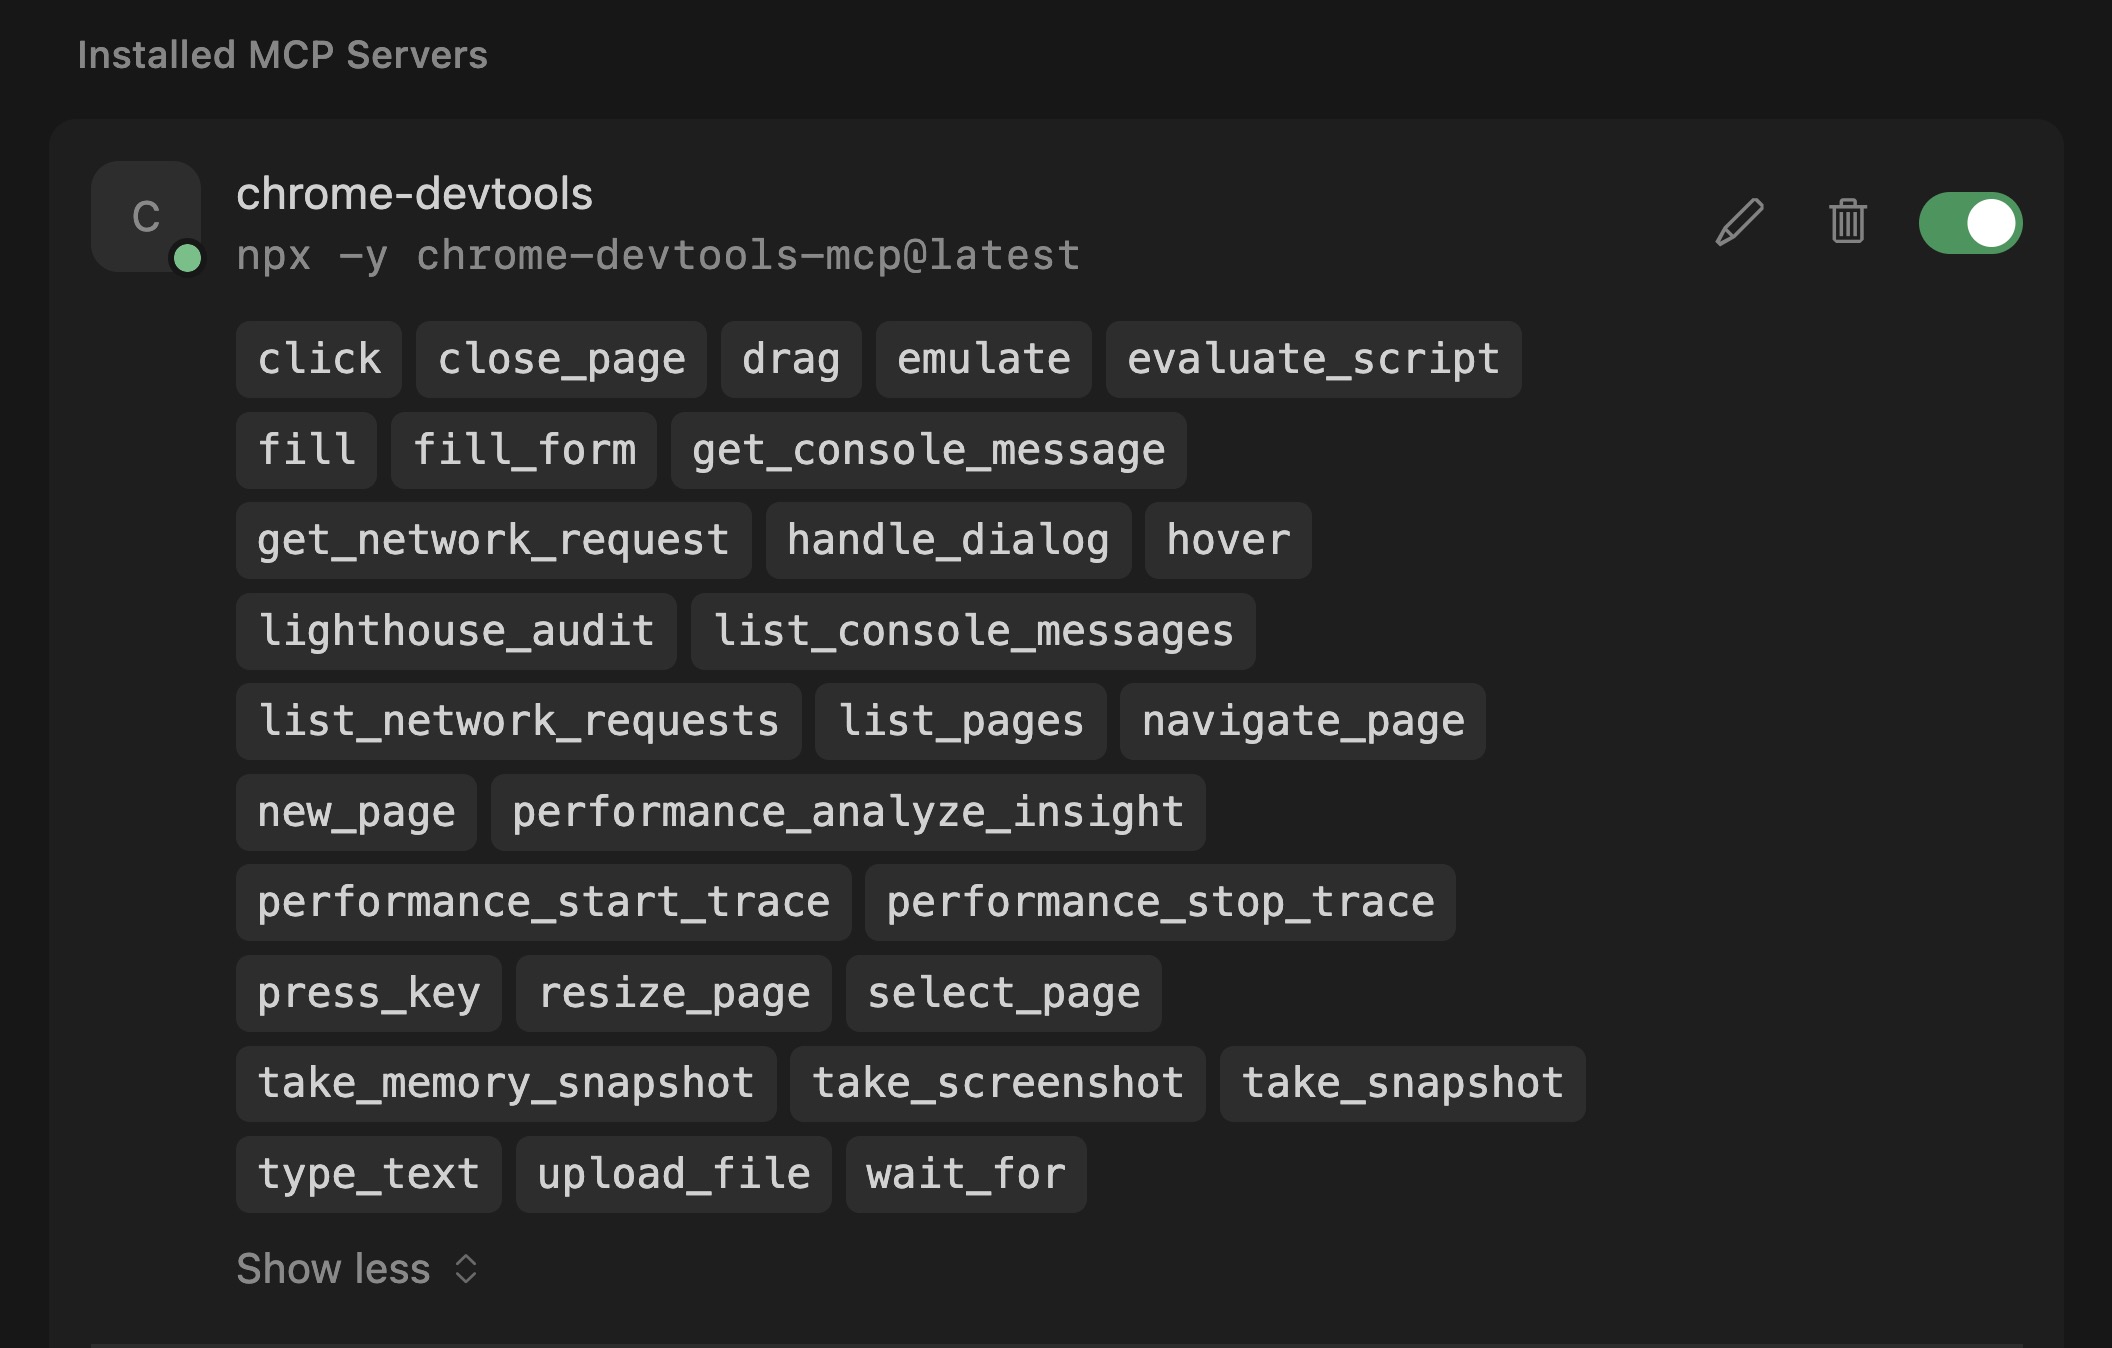
Chrome DevTools MCP server enable on Cursor AI
To verify, ask your AI: “Navigate to https://web.dev and check the page title.” Chrome launches on-demand, navigates, and reports back.
For token-conscious workflows, add --slim to reduce to 3 essential tools: navigate, evaluate script, and screenshot. Add --headless if you don’t need the browser window visible.
Chrome DevTools MCP requires Chrome stable, not Chromium or Edge. Node.js must be version 20.19 or later.
The Two-Tool Audit: Lighthouse + Performance Traces
A complete site audit requires two tools working together.
lighthouse_audit runs Lighthouse for accessibility (0-100), SEO (0-100), and best practices (0-100). It accepts mode (navigation or snapshot) and device (desktop or mobile).
performance_start_trace records a Chrome performance trace. It returns LCP, CLS, and FCP with full breakdowns, render-blocking insights with estimated savings, and network dependency trees.
lighthouse_audit covers accessibility, SEO, and best practices but does not include performance. For Core Web Vitals like LCP, CLS, and FCP, use performance_start_trace separately.
Here’s what a real audit looks like. I ran both tools against a production WordPress site on mobile:
Lighthouse results: Accessibility 91, Best Practices 100, SEO 92 (51 audits passed, 5 failed, 9.3 seconds).
Performance trace: LCP 493ms (TTFB 255ms + Render Delay 238ms), CLS 0.00, 1 render-blocking CSS file with estimated 753ms savings.
The AI combined both outputs and recommended inlining critical CSS and deferring the render-blocking stylesheet.
Step-by-Step Workflow
The typical audit flow:
- Ask the AI to navigate: “Go to https://example.com/page”
- Run the Lighthouse audit: “Run a Lighthouse audit on mobile”
- Run the performance trace: “Record a performance trace and show me the Core Web Vitals”
- Drill into findings: “What’s causing the render-blocking issue?”
You can combine steps. “Navigate to my-site.com, run a Lighthouse audit on mobile, and record a performance trace” works in a single prompt.
LCP Debugging Walkthrough
The MCP server ships with a dedicated debug-optimize-lcp skill that walks through LCP optimization step by step. Every page’s LCP breaks down into four sequential subparts:
| Subpart | Ideal % of LCP | What it measures |
|---|---|---|
| Time to First Byte (TTFB) | ~40% | Navigation start to first byte of HTML |
| Resource load delay | <10% | TTFB to browser starts loading the LCP resource |
| Resource load duration | ~40% | Time to download the LCP resource |
| Element render delay | <10% | LCP resource downloaded to LCP element rendered |
The “delay” subparts should be as close to zero as possible. If either delay is large relative to total LCP, that’s where to optimize first.
I ran this workflow against savvy.co.il. Here’s exactly what happened:
Step 1: Record a Trace
performance_start_trace with reload: true returned LCP of 186ms. The trace identified the LCP element as a <span class="hero-line"> (text, not an image) and listed available insights.
Step 2: Drill into LCPBreakdown
performance_analyze_insight with LCPBreakdown showed: TTFB 2ms (1.3%), Render delay 183ms (98.7%). Because the LCP element is text, there’s no resource to load – only two subparts instead of four.
Step 3: Check Render-Blocking Resources
The RenderBlocking insight identified one CSS file (26ms total, served via h3 + service worker, brotli compressed). It’s fast enough that estimated savings were zero.
Step 4: Identify the LCP Element
The skill includes a JavaScript snippet that uses the PerformanceObserver API to confirm the LCP element. I ran it via evaluate_script and got: SPAN, class hero-line, render time 188ms, no external URL (text-based).
Step 5: Audit Common Issues
A second snippet checks for lazy-loaded images in the viewport, large images missing fetchpriority="high", and render-blocking scripts in the <head>. Result: 0 issues found.
“Each subpart has specific improvement strategies. Ideally, most of the LCP time should be spent on loading the resources, not within delays.” – Chrome DevTools documentation
For a site with image-based LCP, the same workflow would reveal load delay and load duration subparts, and the audit snippet would flag missing fetchpriority or incorrectly lazy-loaded hero images.
Accessibility Auditing in Practice
The lighthouse_audit tool covers accessibility scoring, but the MCP server goes further. The AI can inspect the DOM directly, check ARIA attributes, and evaluate contrast ratios using the accessibility debugging skill and evaluate_script.
CyberAgent tested this at scale with their Spindle design system: 32 components, 236 Storybook stories. They gave the AI a single prompt to audit all stories. The agent navigated through every one, read console errors, applied fixes, and confirmed each. Complete audit in approximately one hour.
CyberAgent developer Kota Yanagi: “It’s been very convenient to offload runtime errors and warning checks that I used to do manually in the browser. I also like that I can now describe complex operations in natural language and have the tool go from reading error logs straight through to fixing the problem.”
SEO Auditing via Lighthouse
The SEO category checks for missing meta descriptions, absent viewport tags, non-crawlable links, and invalid robots.txt directives. Run it alongside a performance trace to see whether your Core Web Vitals are also hurting rankings. If you already use PageSpeed Insights, DevTools MCP doesn’t replace it (CrUX data can’t be replicated in lab tests), but it’s faster for iterative debugging.
As of Lighthouse 13.3, you can also run the new Agentic Browsing audit through the same MCP workflow – useful for tracking how AI-agent-friendly your site is across deploys.
Power Tools Beyond Lighthouse
Five tools I found most practical beyond the headline features:
performance_analyze_insight drills into any trace finding. After a trace flags render-blocking, it returns the exact file URL, timing breakdown, HTTP headers, protocol, and estimated savings.
list_network_requests returns every request filterable by type (script, image, font, stylesheet). Useful for spotting heavy third-party bundles.
list_console_messages filters by severity (error, warn, log). Instant error detection without opening DevTools.
emulate switches network conditions, CPU throttling, viewport, and color scheme in a single call. Network options include Offline, Slow 3G, Fast 3G, and Fast 4G. CPU throttling ranges from 1x to 20x.
evaluate_script runs arbitrary JavaScript in the page. I used it to audit every image’s dimensions and loading attribute – custom checks that Lighthouse doesn’t cover.
Batch Auditing and Automation
The real power shows up when you chain tools together.
Responsive design testing. Use emulate to set a mobile viewport and network throttling, then verify the layout. Repeat for tablet and desktop. One prompt can cycle through all three.
Batch site auditing. Use navigate_page to move between URLs, running lighthouse_audit and performance_start_trace on each. Audit your top 10 landing pages in a single session. The AI summarizes findings across all pages and highlights the worst offenders.
Pre-commit quality gates. I run an automated test before every commit that flags me if any metric decreases. This catches performance regressions before they reach production, not after.
Manual Lighthouse vs. DevTools MCP
Here’s how the two approaches compare:
| Dimension | Manual Lighthouse | DevTools MCP |
|---|---|---|
| Setup | Built into Chrome DevTools | 5-line JSON config + Node.js |
| Runs from | Browser DevTools panel | AI assistant in your editor |
| Performance included | Yes, all categories | Separate tool (performance_start_trace) |
| AI interpretation | None, you read the report | AI parses results and suggests fixes |
| Multi-page audit | Manual, one page at a time | Scriptable, batch multiple pages |
| Custom checks | Not possible | evaluate_script runs any JS |
| Device emulation | Limited presets | Full control: viewport, network, CPU, geolocation |
| Real-world data (CrUX) | Yes, via PageSpeed Insights | No, lab data only |
FAQs
Common questions about Chrome DevTools MCP:
--headless if you don't want to see the browser window.localhost and local network addresses.--slim) reduces to 3 tools: navigate, evaluate script, and screenshot. Full mode exposes all 29 tools. Use slim mode for basic browser tasks when context window space is tight.performance_start_trace tool. PageSpeed Insights also provides real-user CrUX data that lab testing cannot replicate.Summary
Chrome DevTools MCP v0.19 gives AI assistants full visibility into the browser: Lighthouse for accessibility, SEO, and best practices, plus performance_start_trace for Core Web Vitals.
The two-tool split is the key pattern. Point your AI at a page, run both, and get a prioritized fix list without leaving the editor.