Bounce Rate measures the percentage of sessions where a user leaves your site without meaningful engagement. The exact definition depends on which version of Google Analytics you use.
In Universal Analytics (now discontinued), a bounce was a single-page session with no additional requests to the Analytics server. In Google Analytics 4 (GA4), a bounce is any session that does not qualify as an “engaged session.”
Bounce Rate and Exit Rate are not the same thing. Bounce Rate measures sessions where the user left without engaging. Exit Rate measures the percentage of pageviews where a specific page was the last one viewed. A page can have a low bounce rate but a high exit rate.

Is a High Bounce Rate Always Bad?
It depends.
If your site relies on users viewing more than one page, then yes, a high bounce rate is a problem.
For example, if your homepage is a gateway to product pages or articles and most users leave from the homepage without clicking anything, that high bounce rate needs attention.
On the other hand, for a blog or content site where single-page sessions are expected, a higher bounce rate can be perfectly normal.
If the overall bounce rate is high, investigate whether it is consistent across the site or driven by specific pages, traffic sources, or mediums.
If certain pages are the problem, check whether the content matches what your marketing promises. Also check if those pages offer clear next steps for the user.
If a specific channel has a high bounce rate, examine your marketing efforts for that channel. The issue might be a mismatch between the ad copy and the landing page content.
If the problem is site-wide, verify that your tracking code loads correctly on all pages. Also review your site’s design, calls to action, and the visibility of key elements.
For single-page sites, look into non-interaction events to better capture user engagement without triggering false bounces.
How to View Bounce Rate in Google Analytics
There is a key difference between Universal Analytics (UA) and Google Analytics 4 (GA4). Here is a comparison table (desktop only), followed by instructions for each platform:
Universal Analytics (Discontinued)
Universal Analytics was permanently shut down in July 2023. This section is kept for reference only. All active tracking should use GA4.
In UA, you could check the Bounce Rate from multiple reports:
- The Audience > Overview report provides the general site-wide exit rate.
- The Acquisition > All Traffic > Channels report provides the exit rate for each channel (organic, social, etc.).
- The Acquisition > All Traffic > Source/Medium report provides the exit rate for each source/medium pair.
- The Behavior > Site Content > All Pages report provides the exit rate for individual pages.
Google Analytics 4 (GA4)
GA4 redefines bounce rate. Instead of measuring single-page sessions, it measures non-engaged sessions. The primary metric is Engagement Rate.
A session counts as engaged if any of these conditions are met:
- The user spends 10 seconds or more on the site.
- The user views two or more pages on the site.
- A key event (conversion) is triggered during the session.
You can think of the Engagement Rate as the inverse of the Bounce Rate.
Bounce Rate in GA4 is simply 100% minus the Engagement Rate. For example, if your Engagement Rate is 85%, your Bounce Rate is 15%.
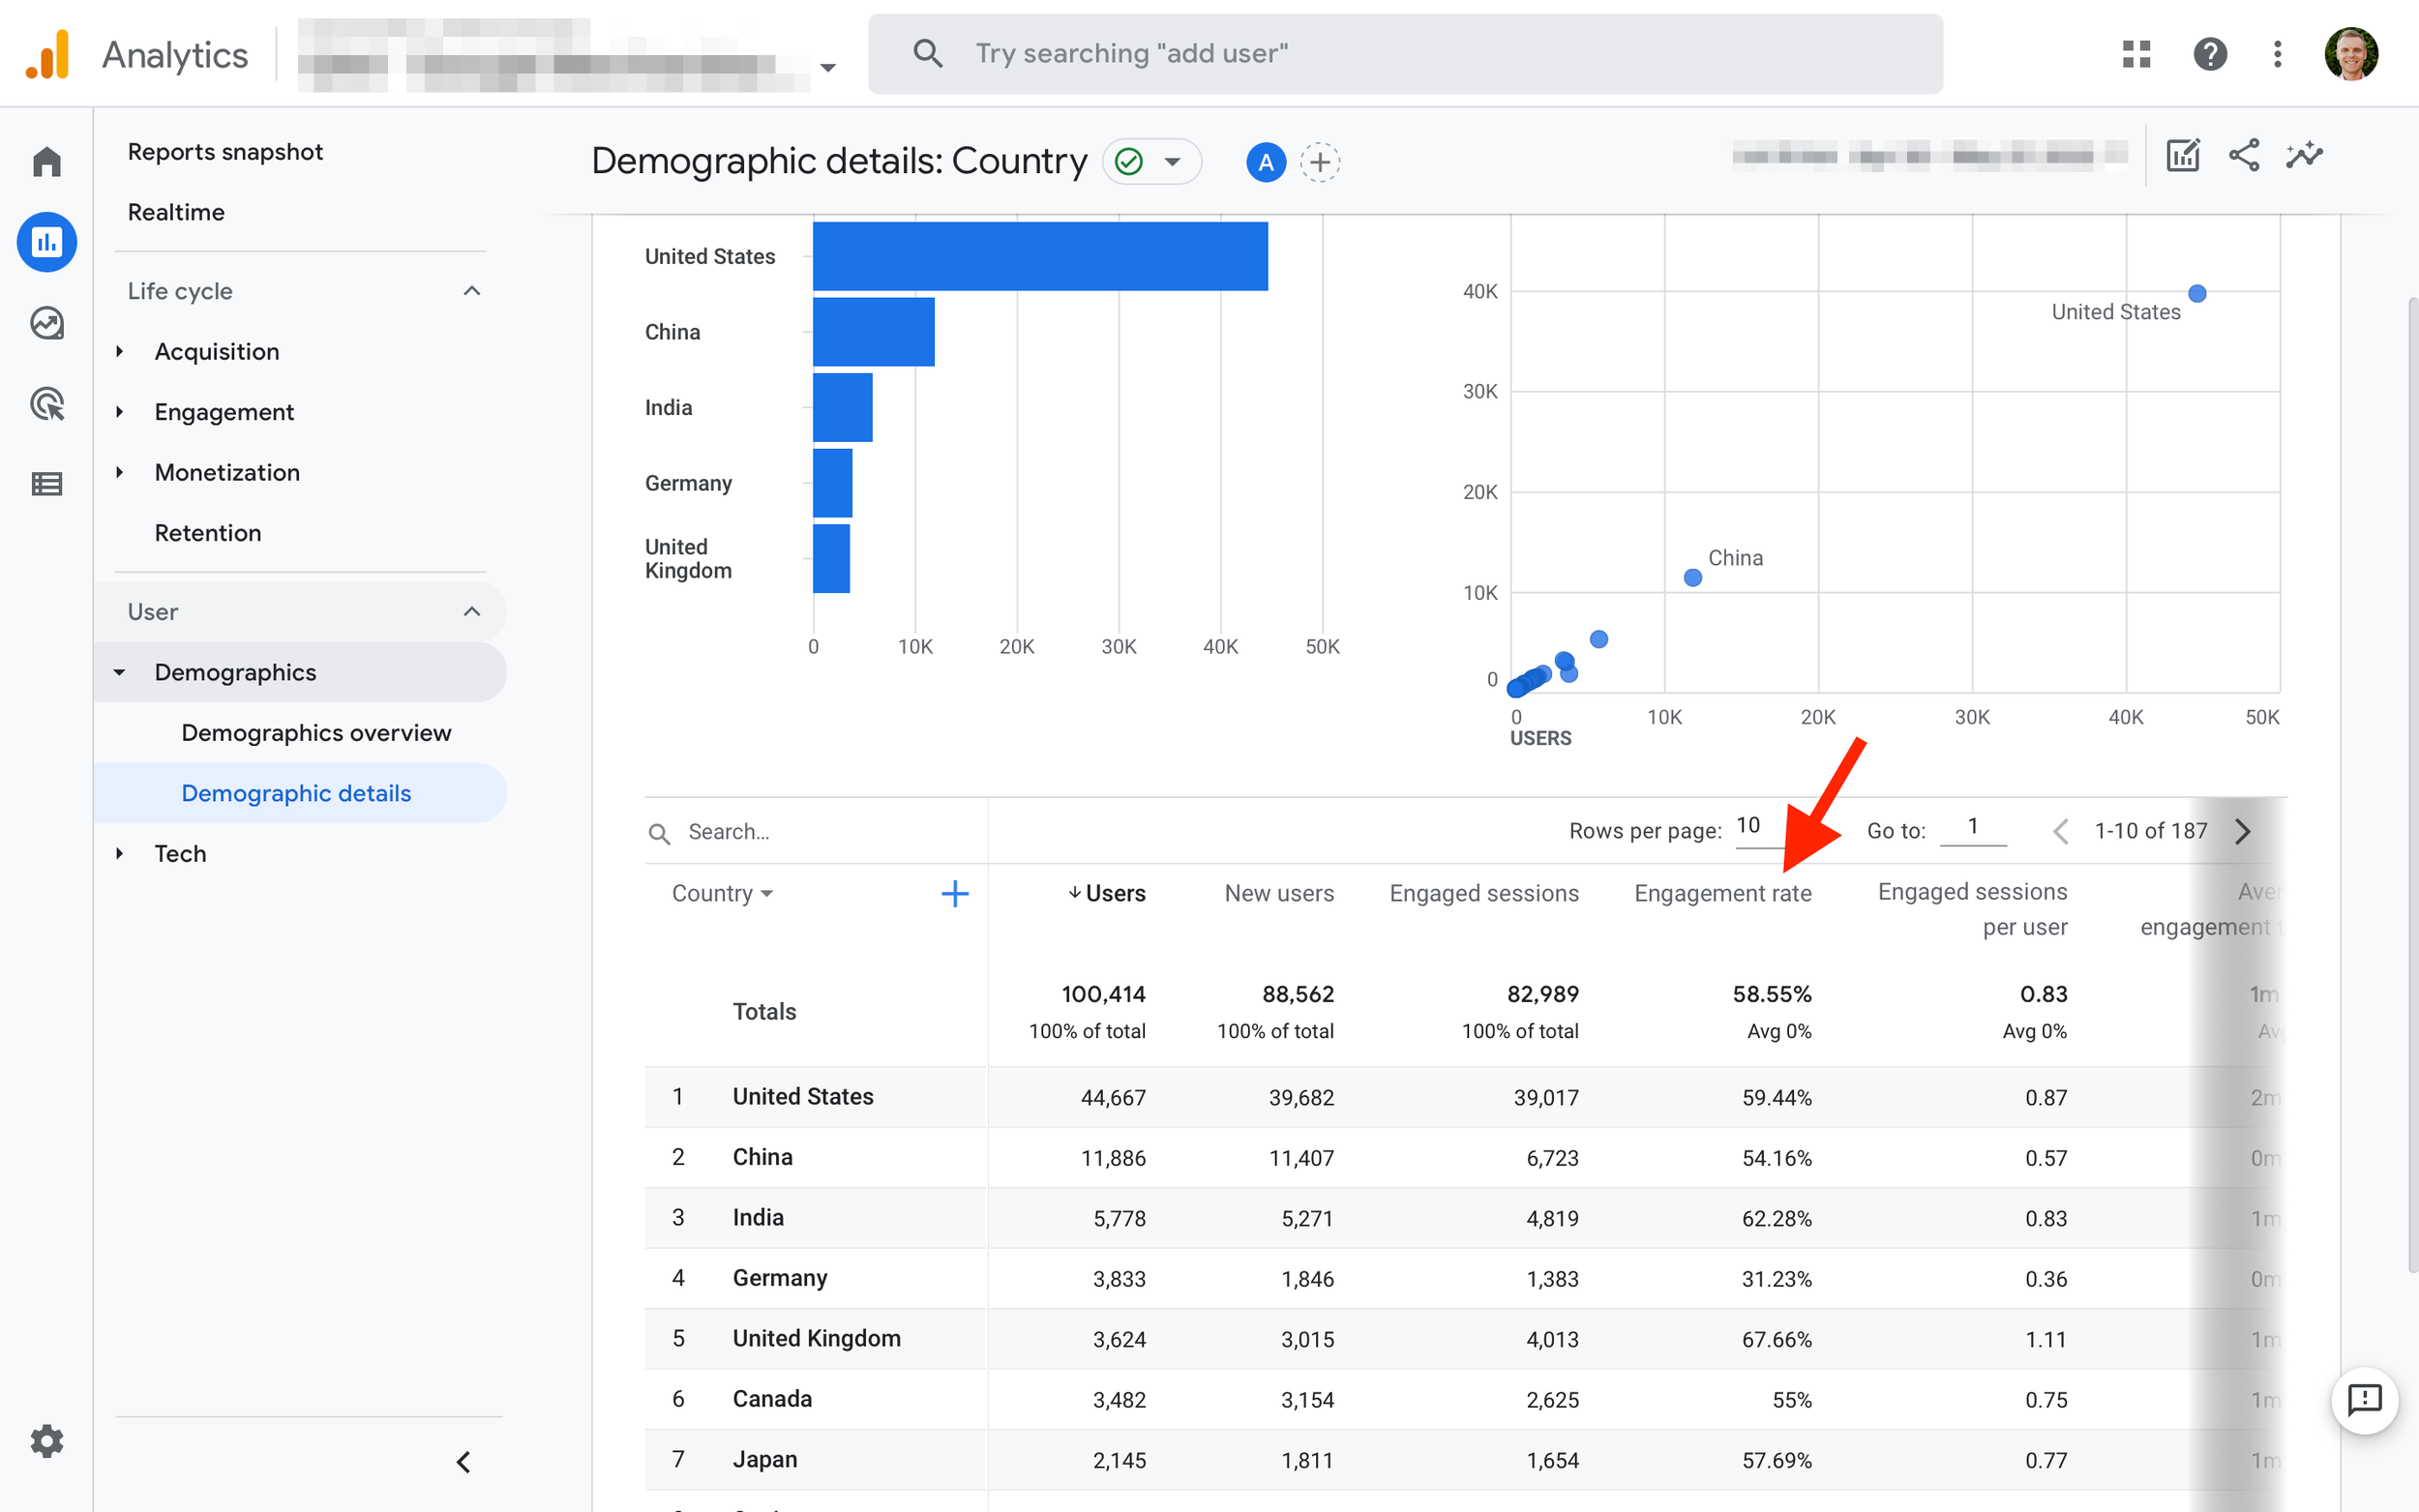
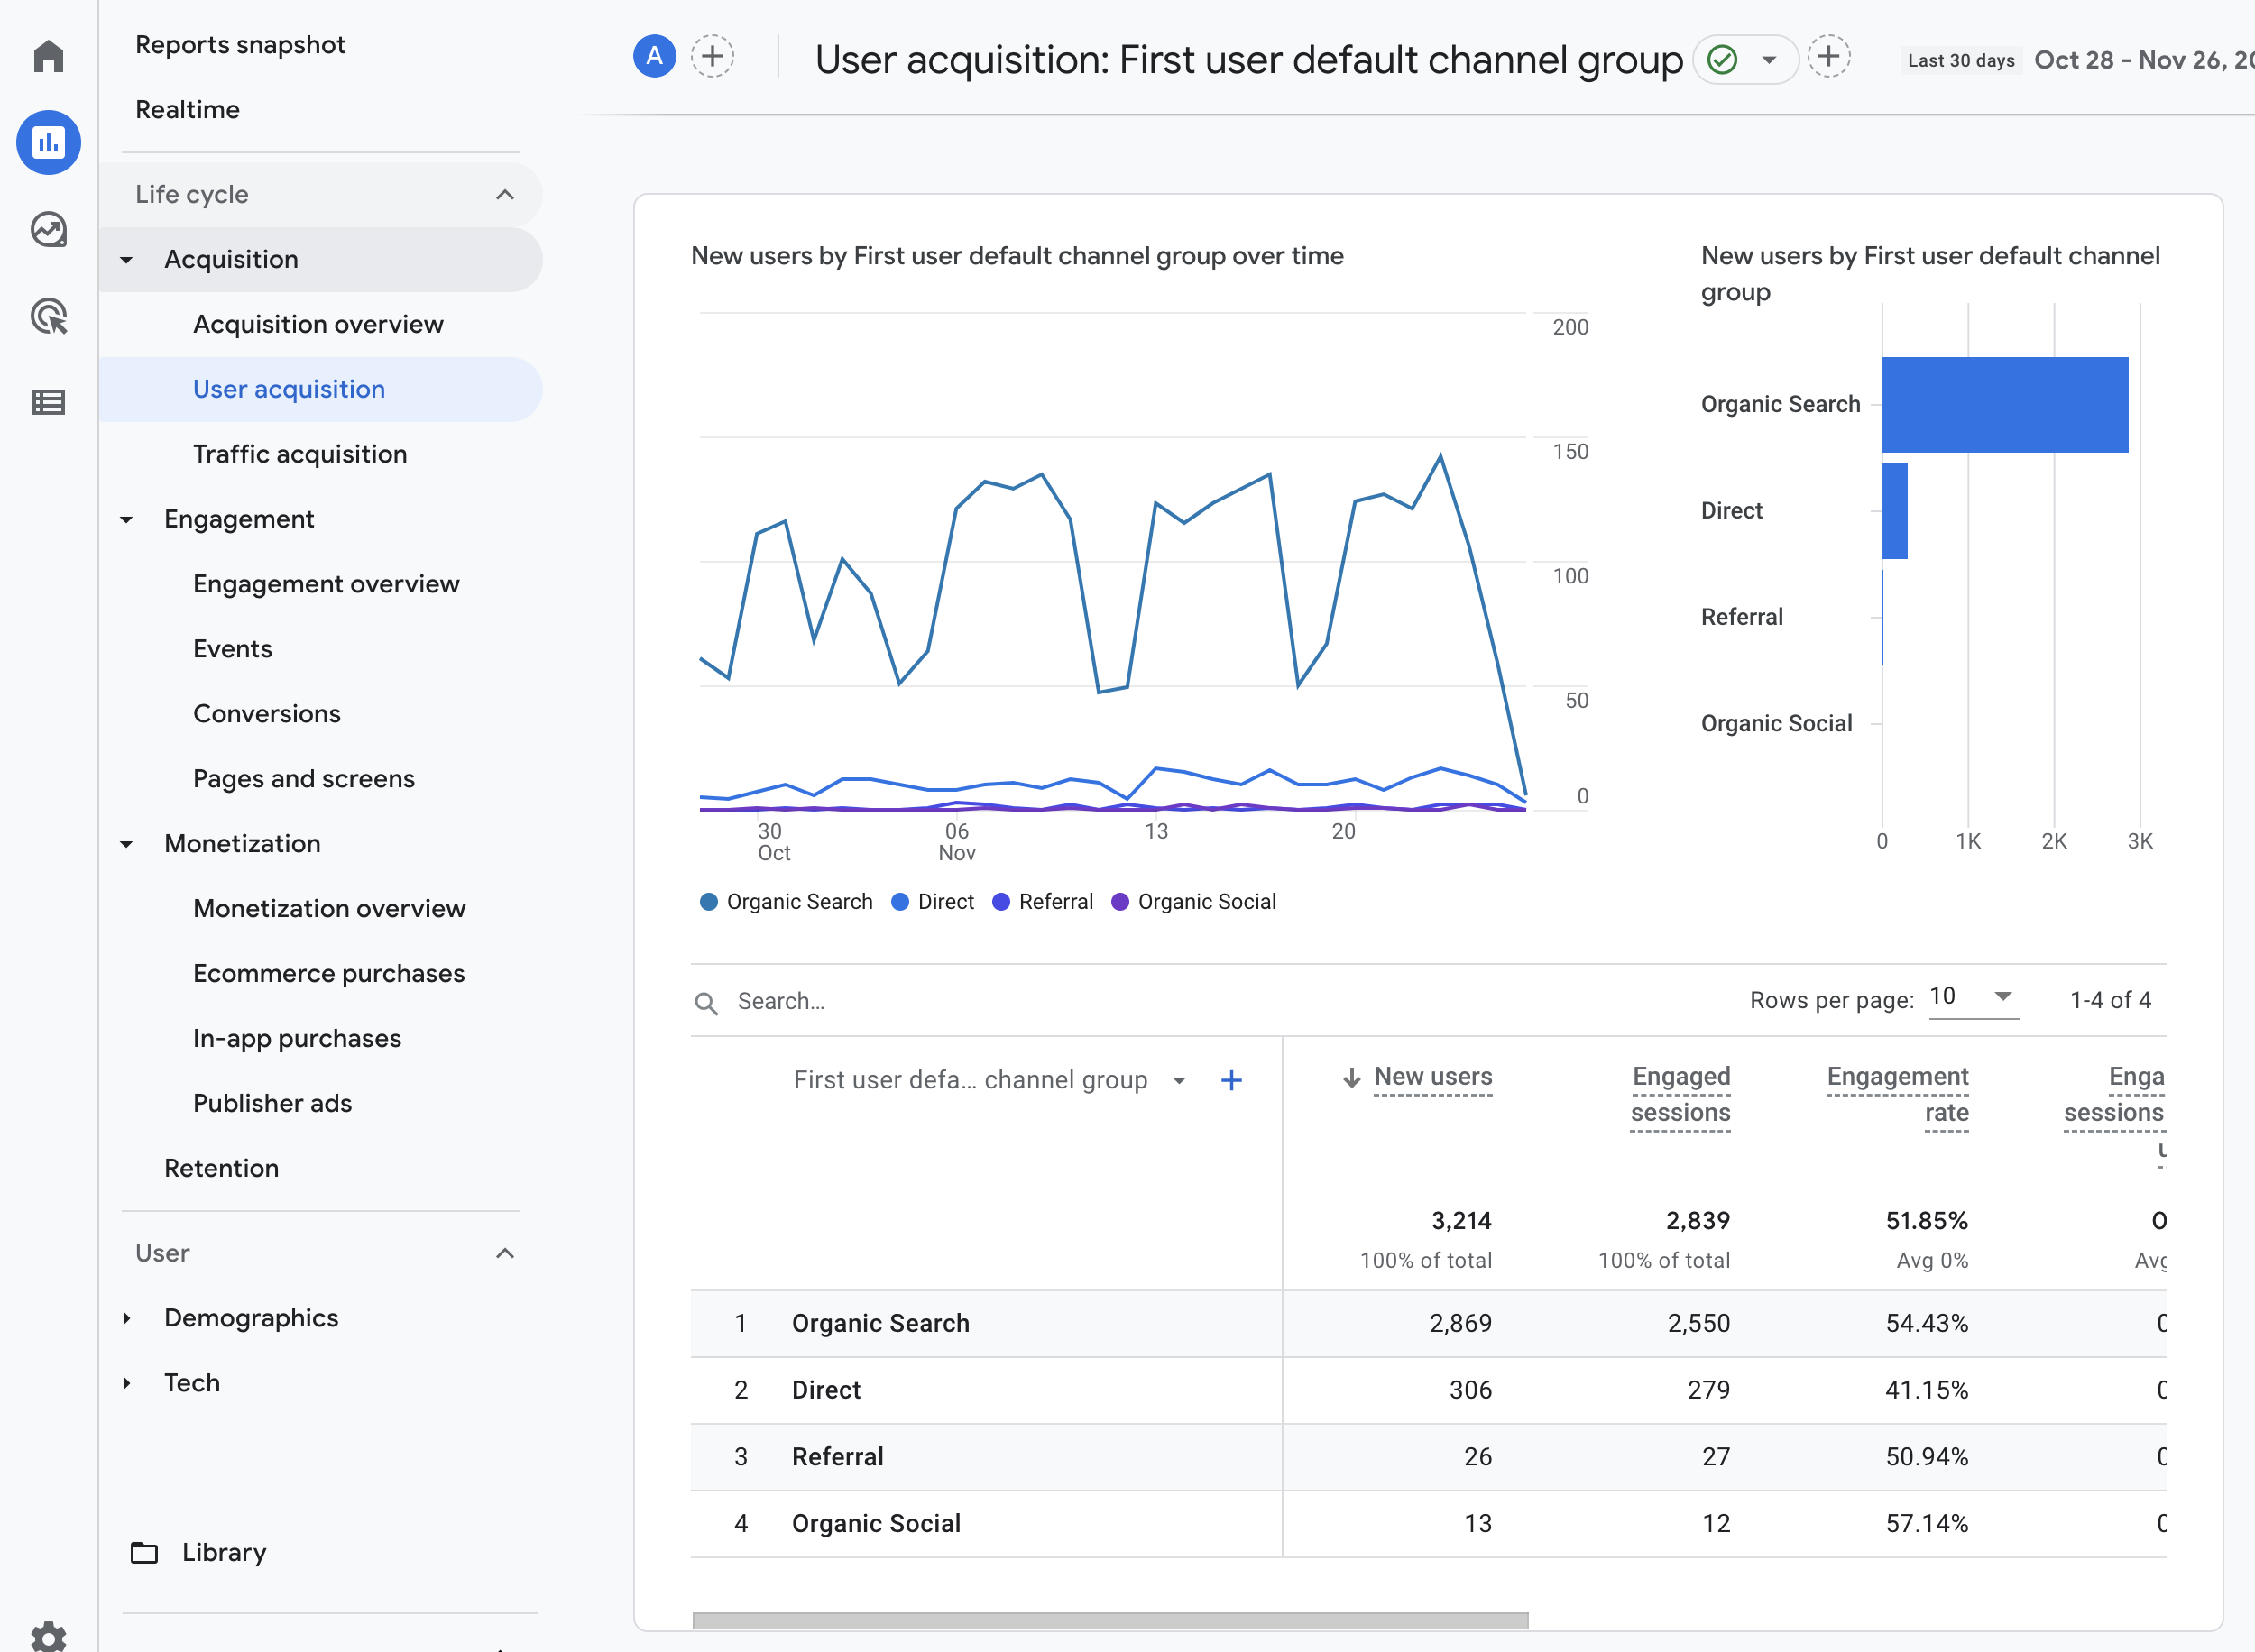
Either way, to see the Engagement Rate data in the GA4 interface, navigate to Reports, then under the Acquisition > User Acquisition tab, go to Acquisition > Traffic Acquisition.

FAQs
Common questions about bounce rate:
Summary
Bounce rate measures how often users leave your site without engaging. In GA4, it is the inverse of the Engagement Rate.
A high bounce rate is not always bad – it depends on the type of page and the expected user behavior. Focus on understanding why users leave and whether the content matches their intent.


