If your WordPress site feels sluggish when users click buttons, open menus, or interact with forms, there’s a Core Web Vital metric that measures exactly that. It’s called INP – Interaction to Next Paint.
Google replaced First Input Delay (FID) with INP on March 12, 2024. Unlike FID, which only measured the delay of the very first interaction, INP tracks every interaction a user makes during their visit and reports the worst one.
This post covers what INP is, how it differs from FID, how to measure it, and the practical WordPress-specific fixes you can apply today.
What Is Interaction to Next Paint (INP)?
INP measures the time between a user interaction (click, tap, or keypress) and the moment the browser paints the next visual update. It’s a responsiveness metric.
The final INP value for a page visit is the single longest interaction observed throughout the session (with some outlier filtering on pages that have many interactions).
Good INP values are 200 milliseconds or less. Poor values are greater than 500 milliseconds. – web.dev
Here are the thresholds:
- Good: 200 ms or less
- Needs Improvement: between 200 ms and 500 ms
- Poor: above 500 ms
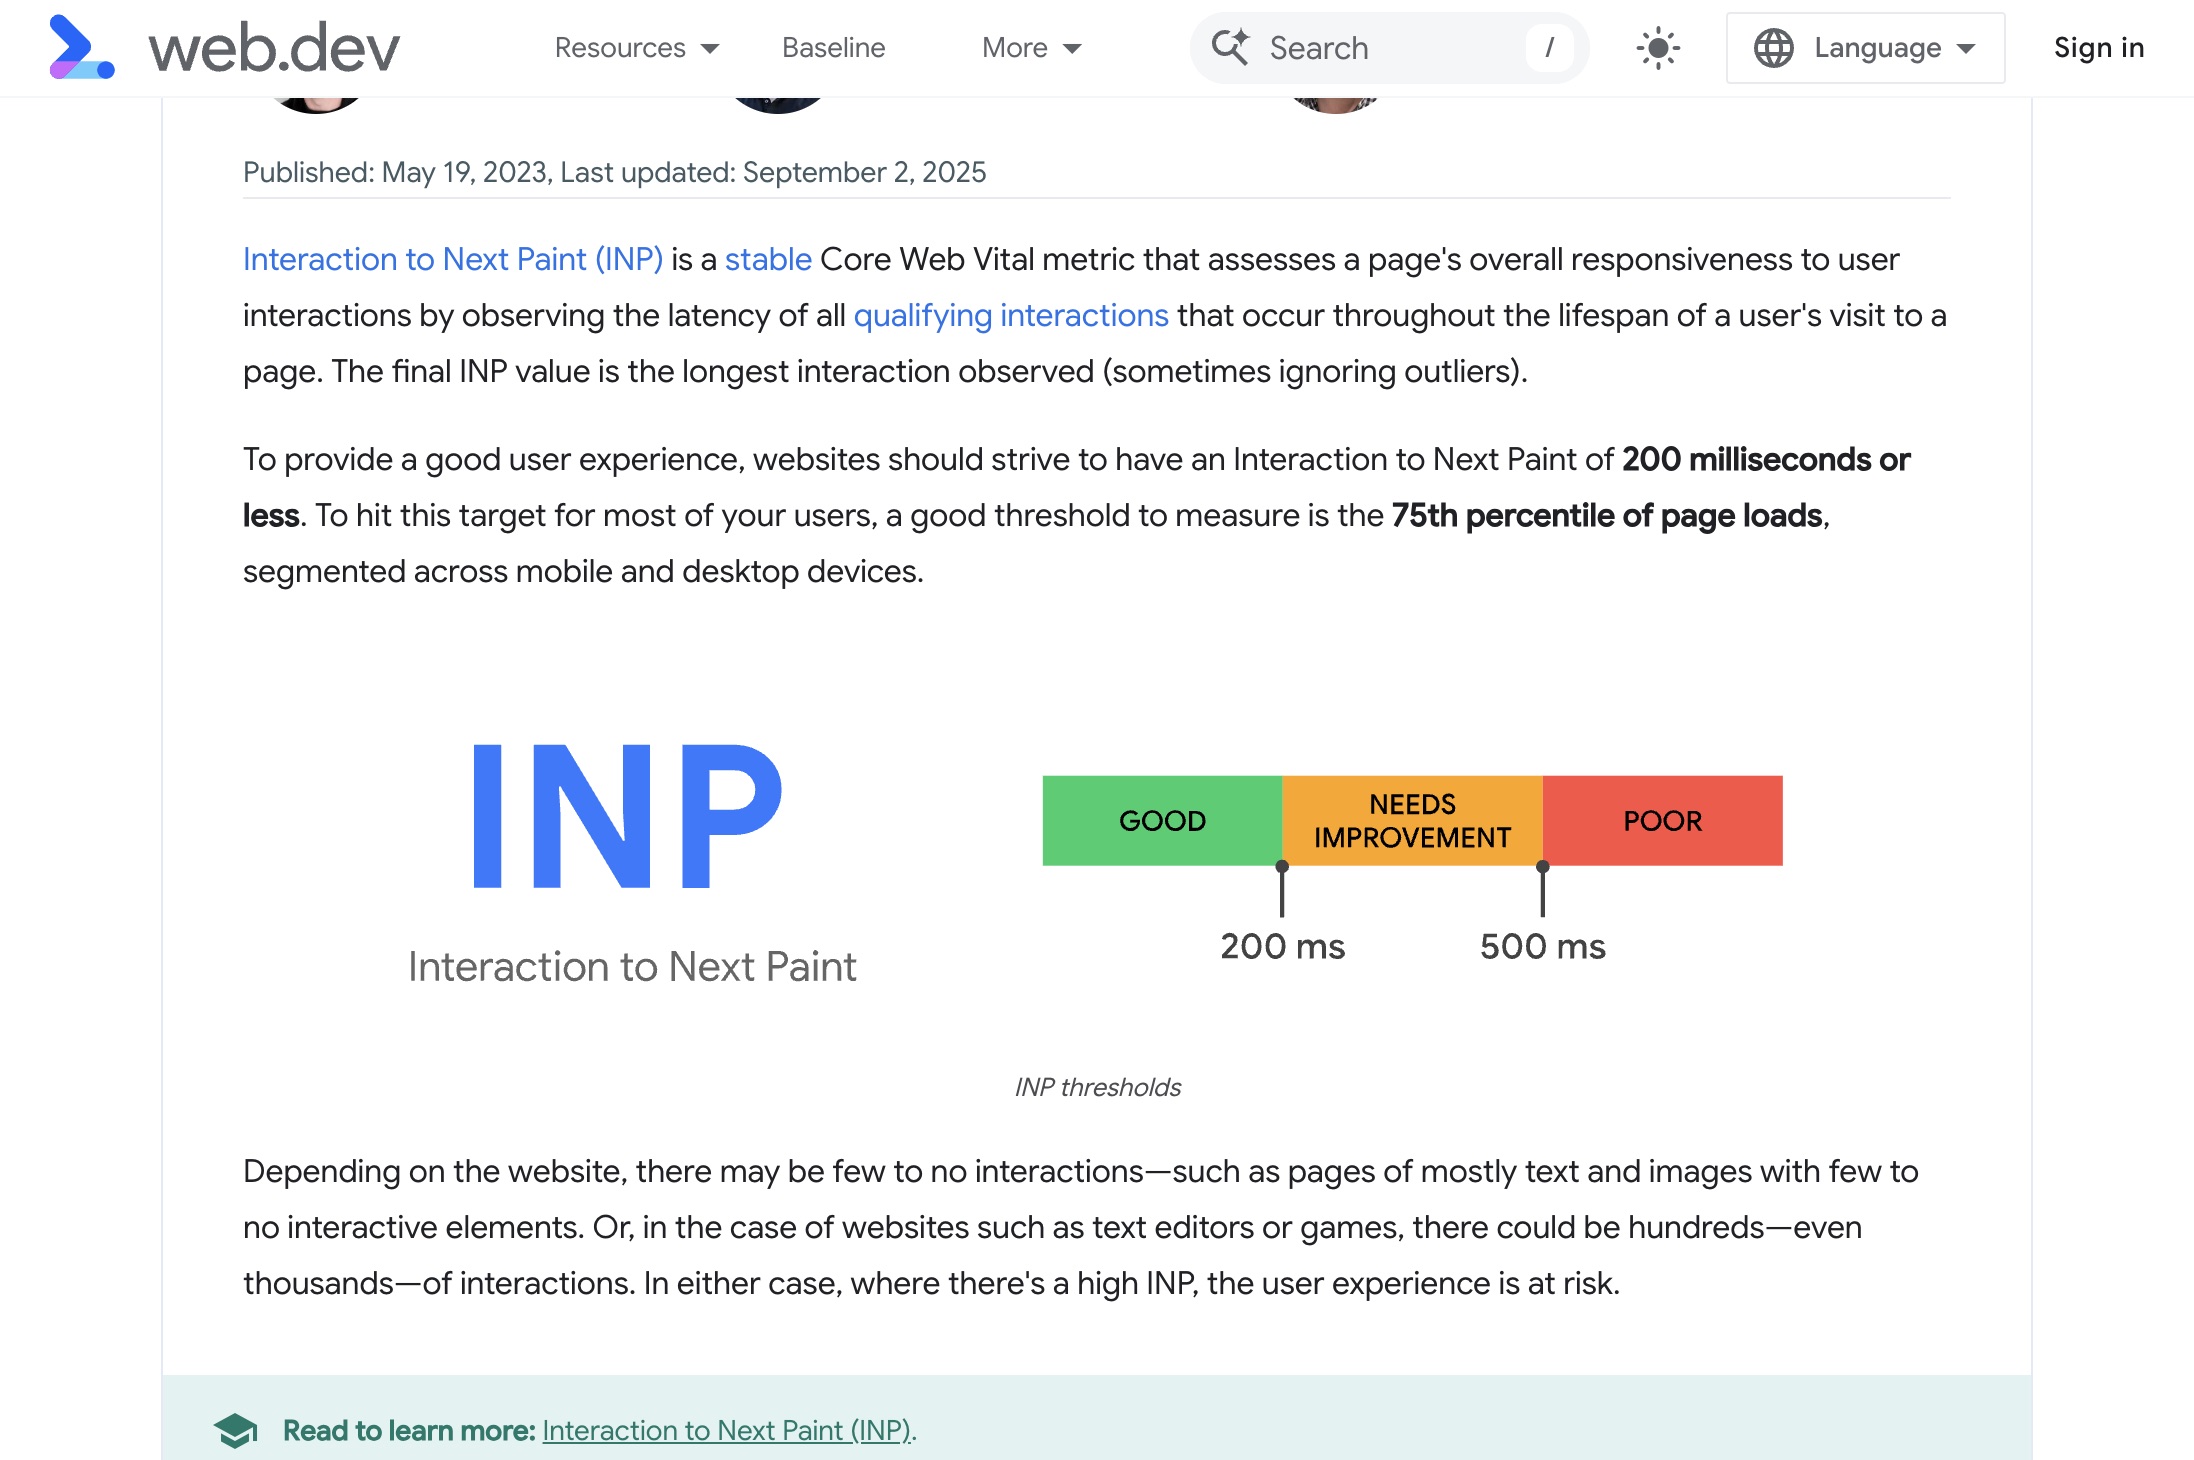
Google measures INP at the 75th percentile of page loads, segmented across mobile and desktop. If 75% of your visitors experience interactions under 200 ms, your page passes.
How INP Differs from FID
FID measured only the input delay of the first interaction on a page. That means it ignored two important things.
First, it ignored every interaction after the first one. A user might click a menu, fill out a form, and scroll through a carousel – FID only cared about that initial click.
Second, FID only measured the delay before the browser started processing the event. It did not measure how long the event handler took to run, or how long the browser needed to paint the result.
INP captures the full round-trip of an interaction: from the moment the user clicks or taps, through event handler execution, all the way to the next frame painted on screen. This makes it a much better indicator of how responsive your site actually feels.
In practice, a site could pass FID easily (because the first interaction happened after the main thread was idle) while still feeling slow during later interactions. INP catches those problems.
The Three Phases of INP
Every interaction that INP measures goes through three distinct phases. Understanding them helps you figure out where to focus your optimization work.
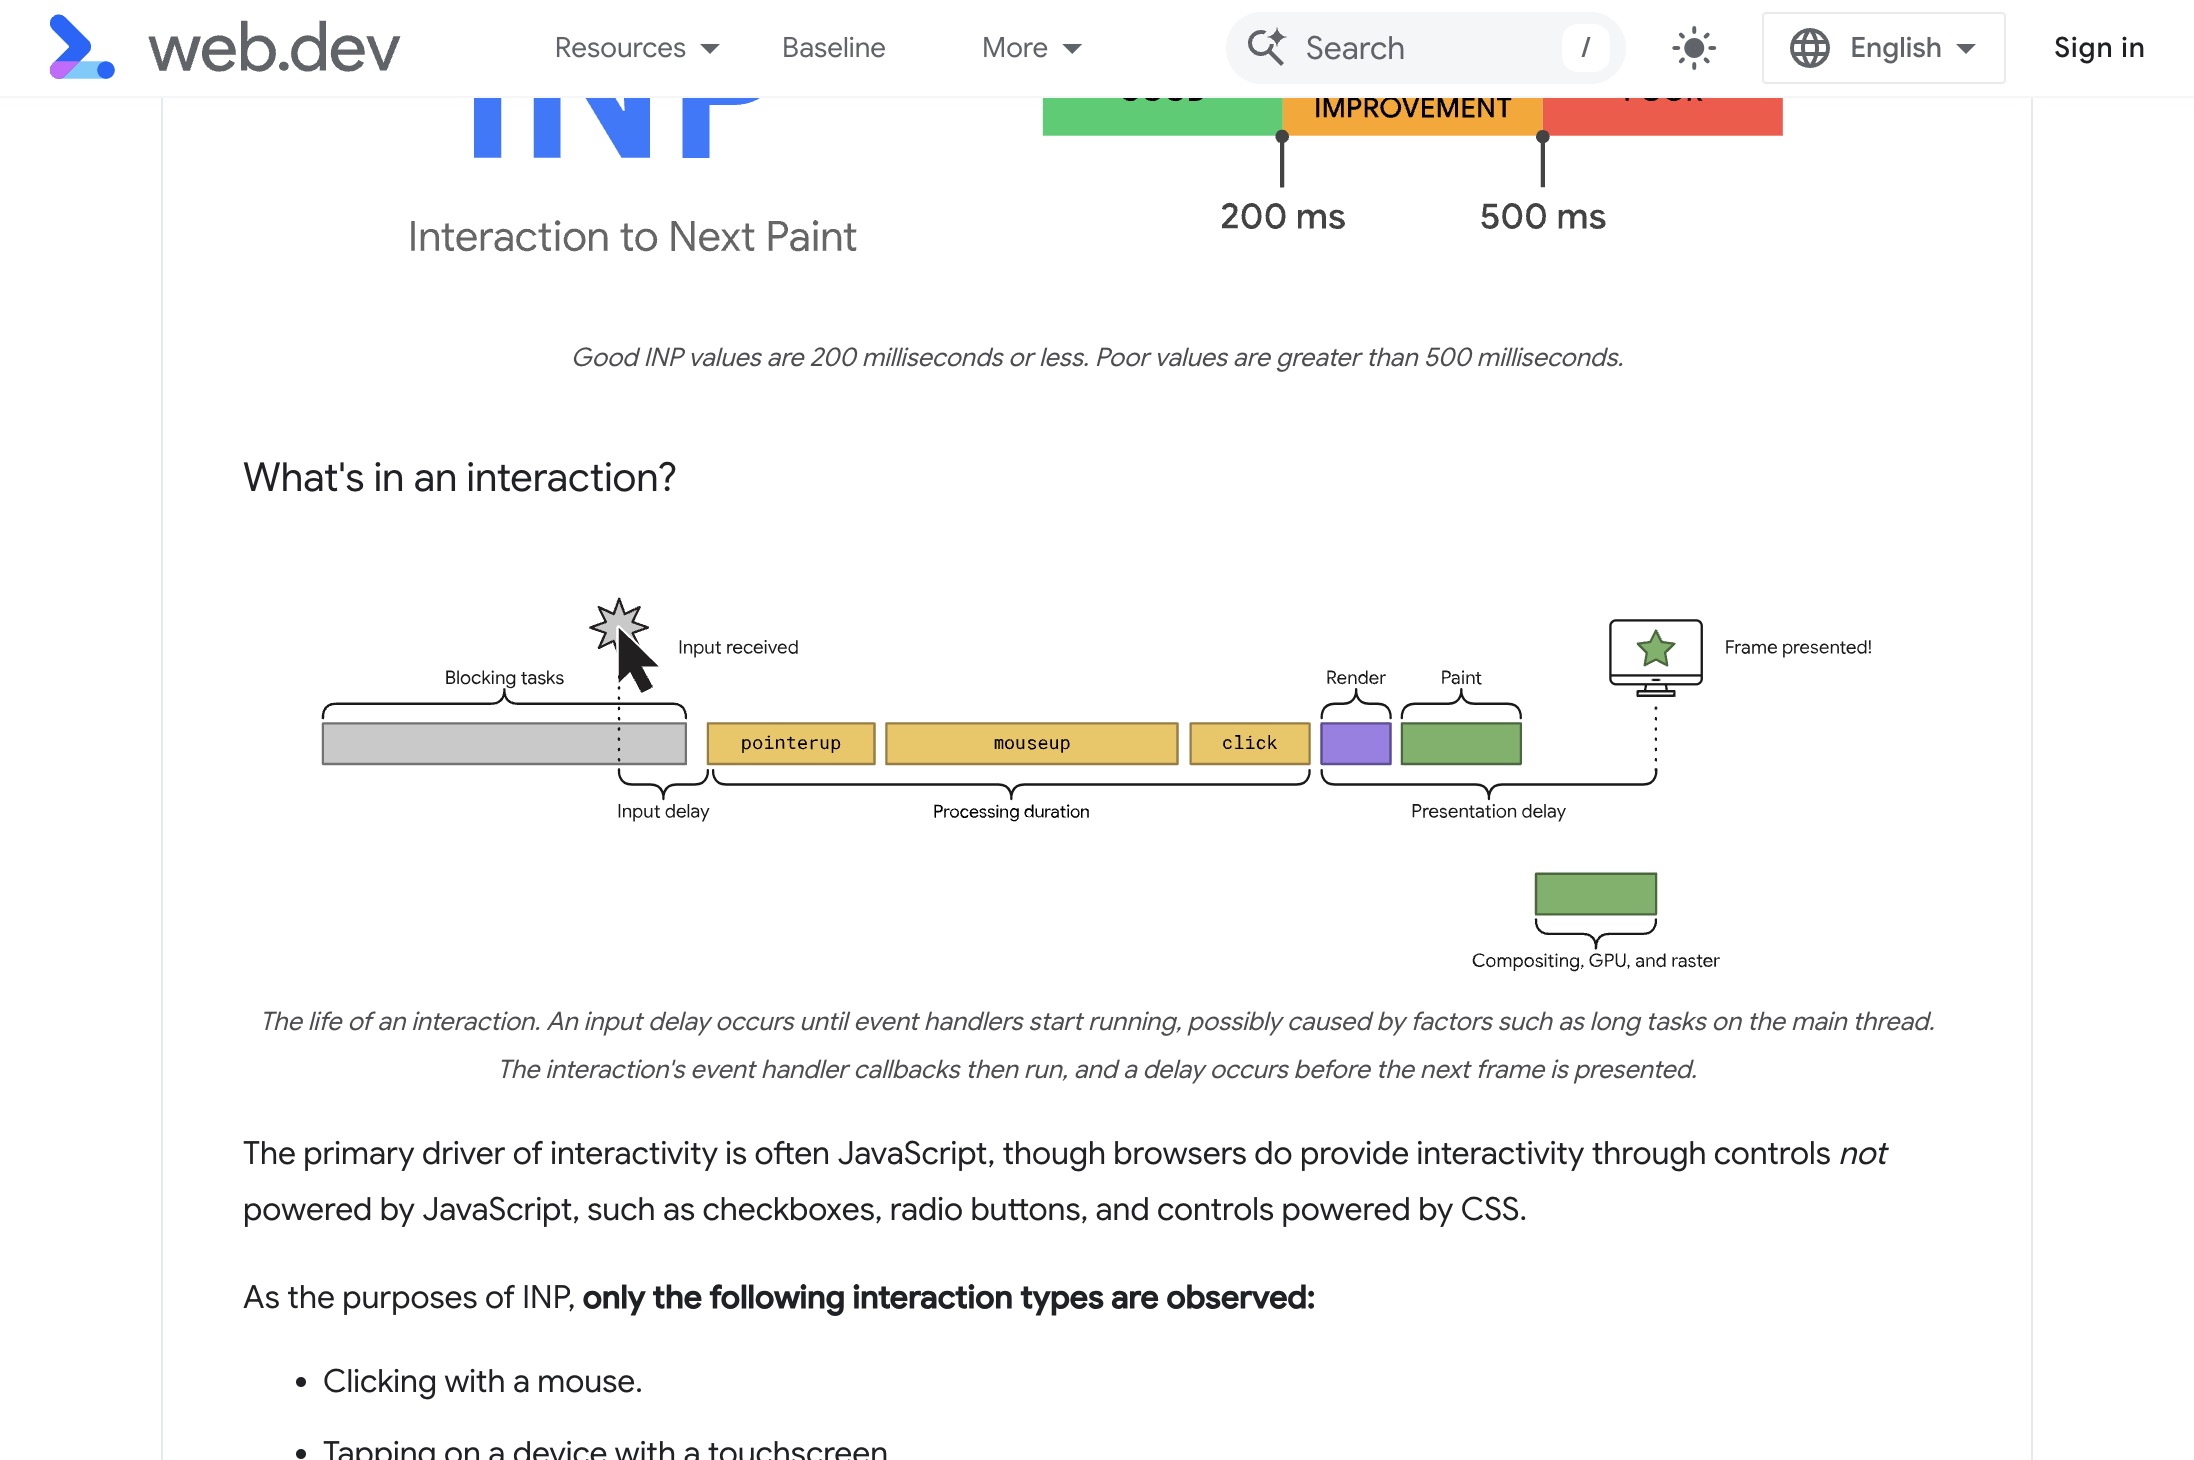
Input Delay
This is the time between when the user interacts (e.g. clicks a button) and when the browser starts running the event handler for that interaction.
Input delay happens when the main thread is busy with other work – typically long-running JavaScript tasks. If a third-party analytics script is executing a 300 ms task when the user clicks, the browser can’t start processing the click until that task finishes.
Processing Time
This is the time the browser spends running the event handler callbacks themselves. If your click handler runs a complex DOM manipulation, fetches data synchronously, or triggers a heavy re-render, processing time increases.
A single interaction can fire multiple event handlers (e.g. pointerdown, pointerup, click). The processing time is the combined duration of all of them.
Presentation Delay
After the event handlers finish, the browser still needs to recalculate styles, run layout, and paint the updated pixels. This is the presentation delay.
Large DOM trees, complex CSS selectors, and forced layout recalculations (layout thrashing) all increase presentation delay. If your page has thousands of DOM nodes, every style recalculation takes longer.
How to Measure INP
You have several tools available to measure and diagnose INP issues.
PageSpeed Insights (Field Data)
The most straightforward way to check your site’s INP is PageSpeed Insights. The “Discover what your real users are experiencing” section at the top shows field data from the Chrome User Experience Report (CrUX).
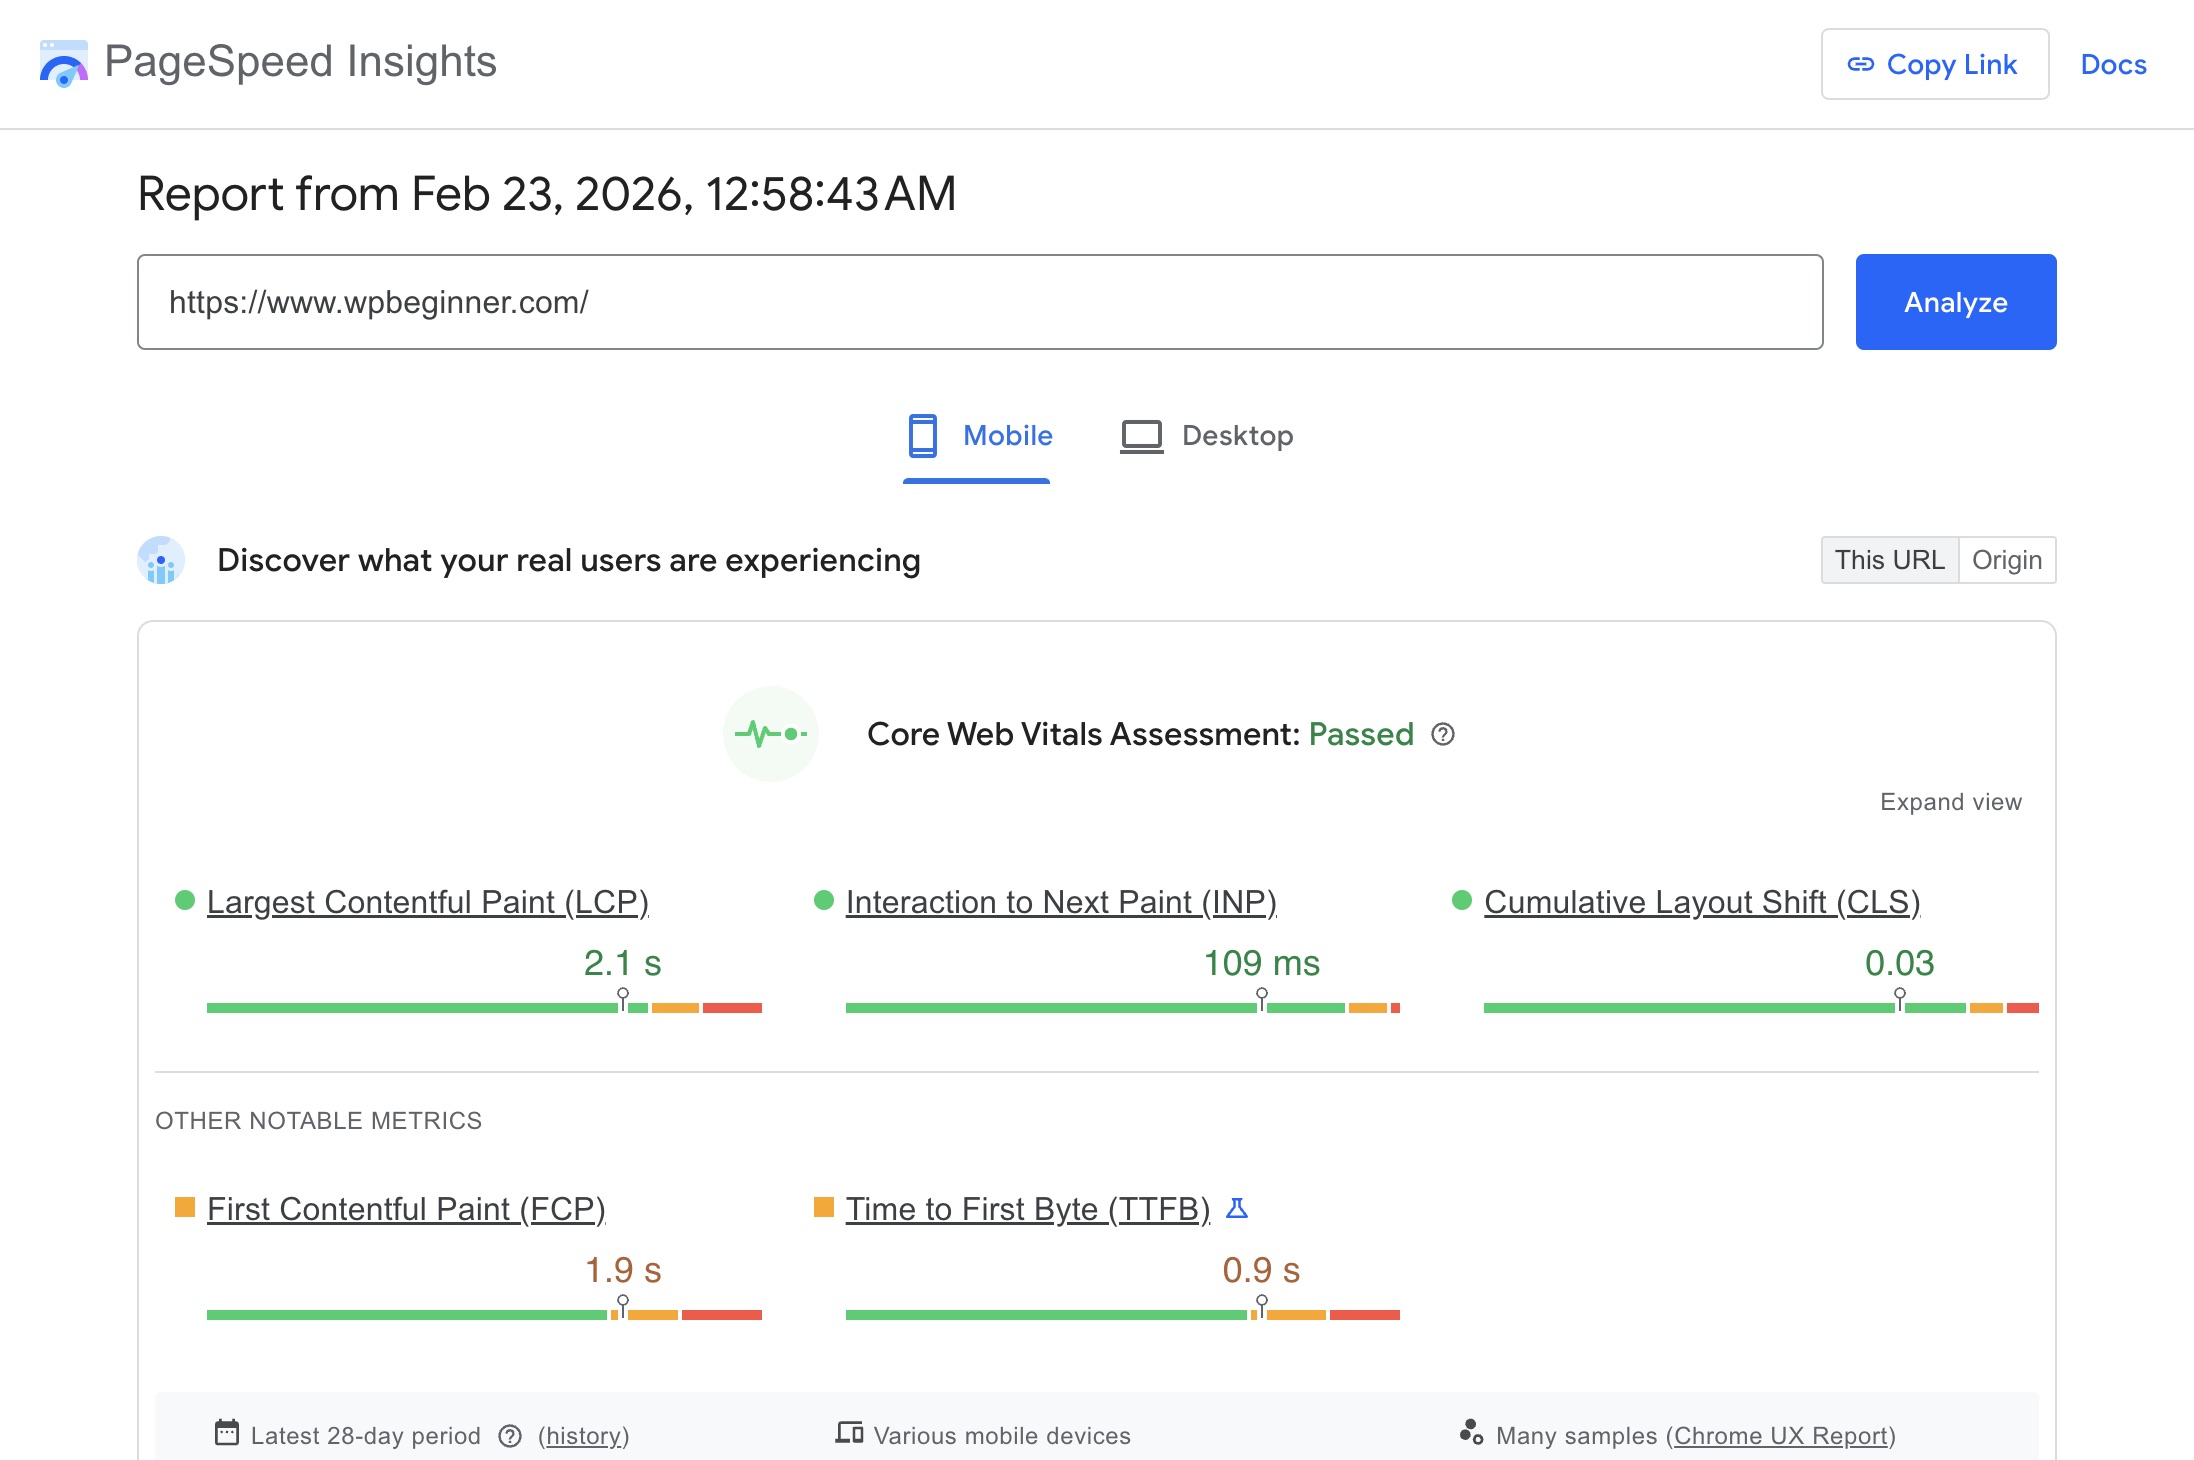
If your page doesn’t have enough traffic for CrUX data, INP will show “N/A”. In that case, switch to the “Origin” view to see aggregate data across your entire domain.
PageSpeed Insights (Diagnostics)
Scroll down past the Lighthouse score to find the Diagnostics section. Look for entries like “Minimize main-thread work”, “Reduce JavaScript execution time”, and “Avoid an excessive DOM size” – these directly affect INP.
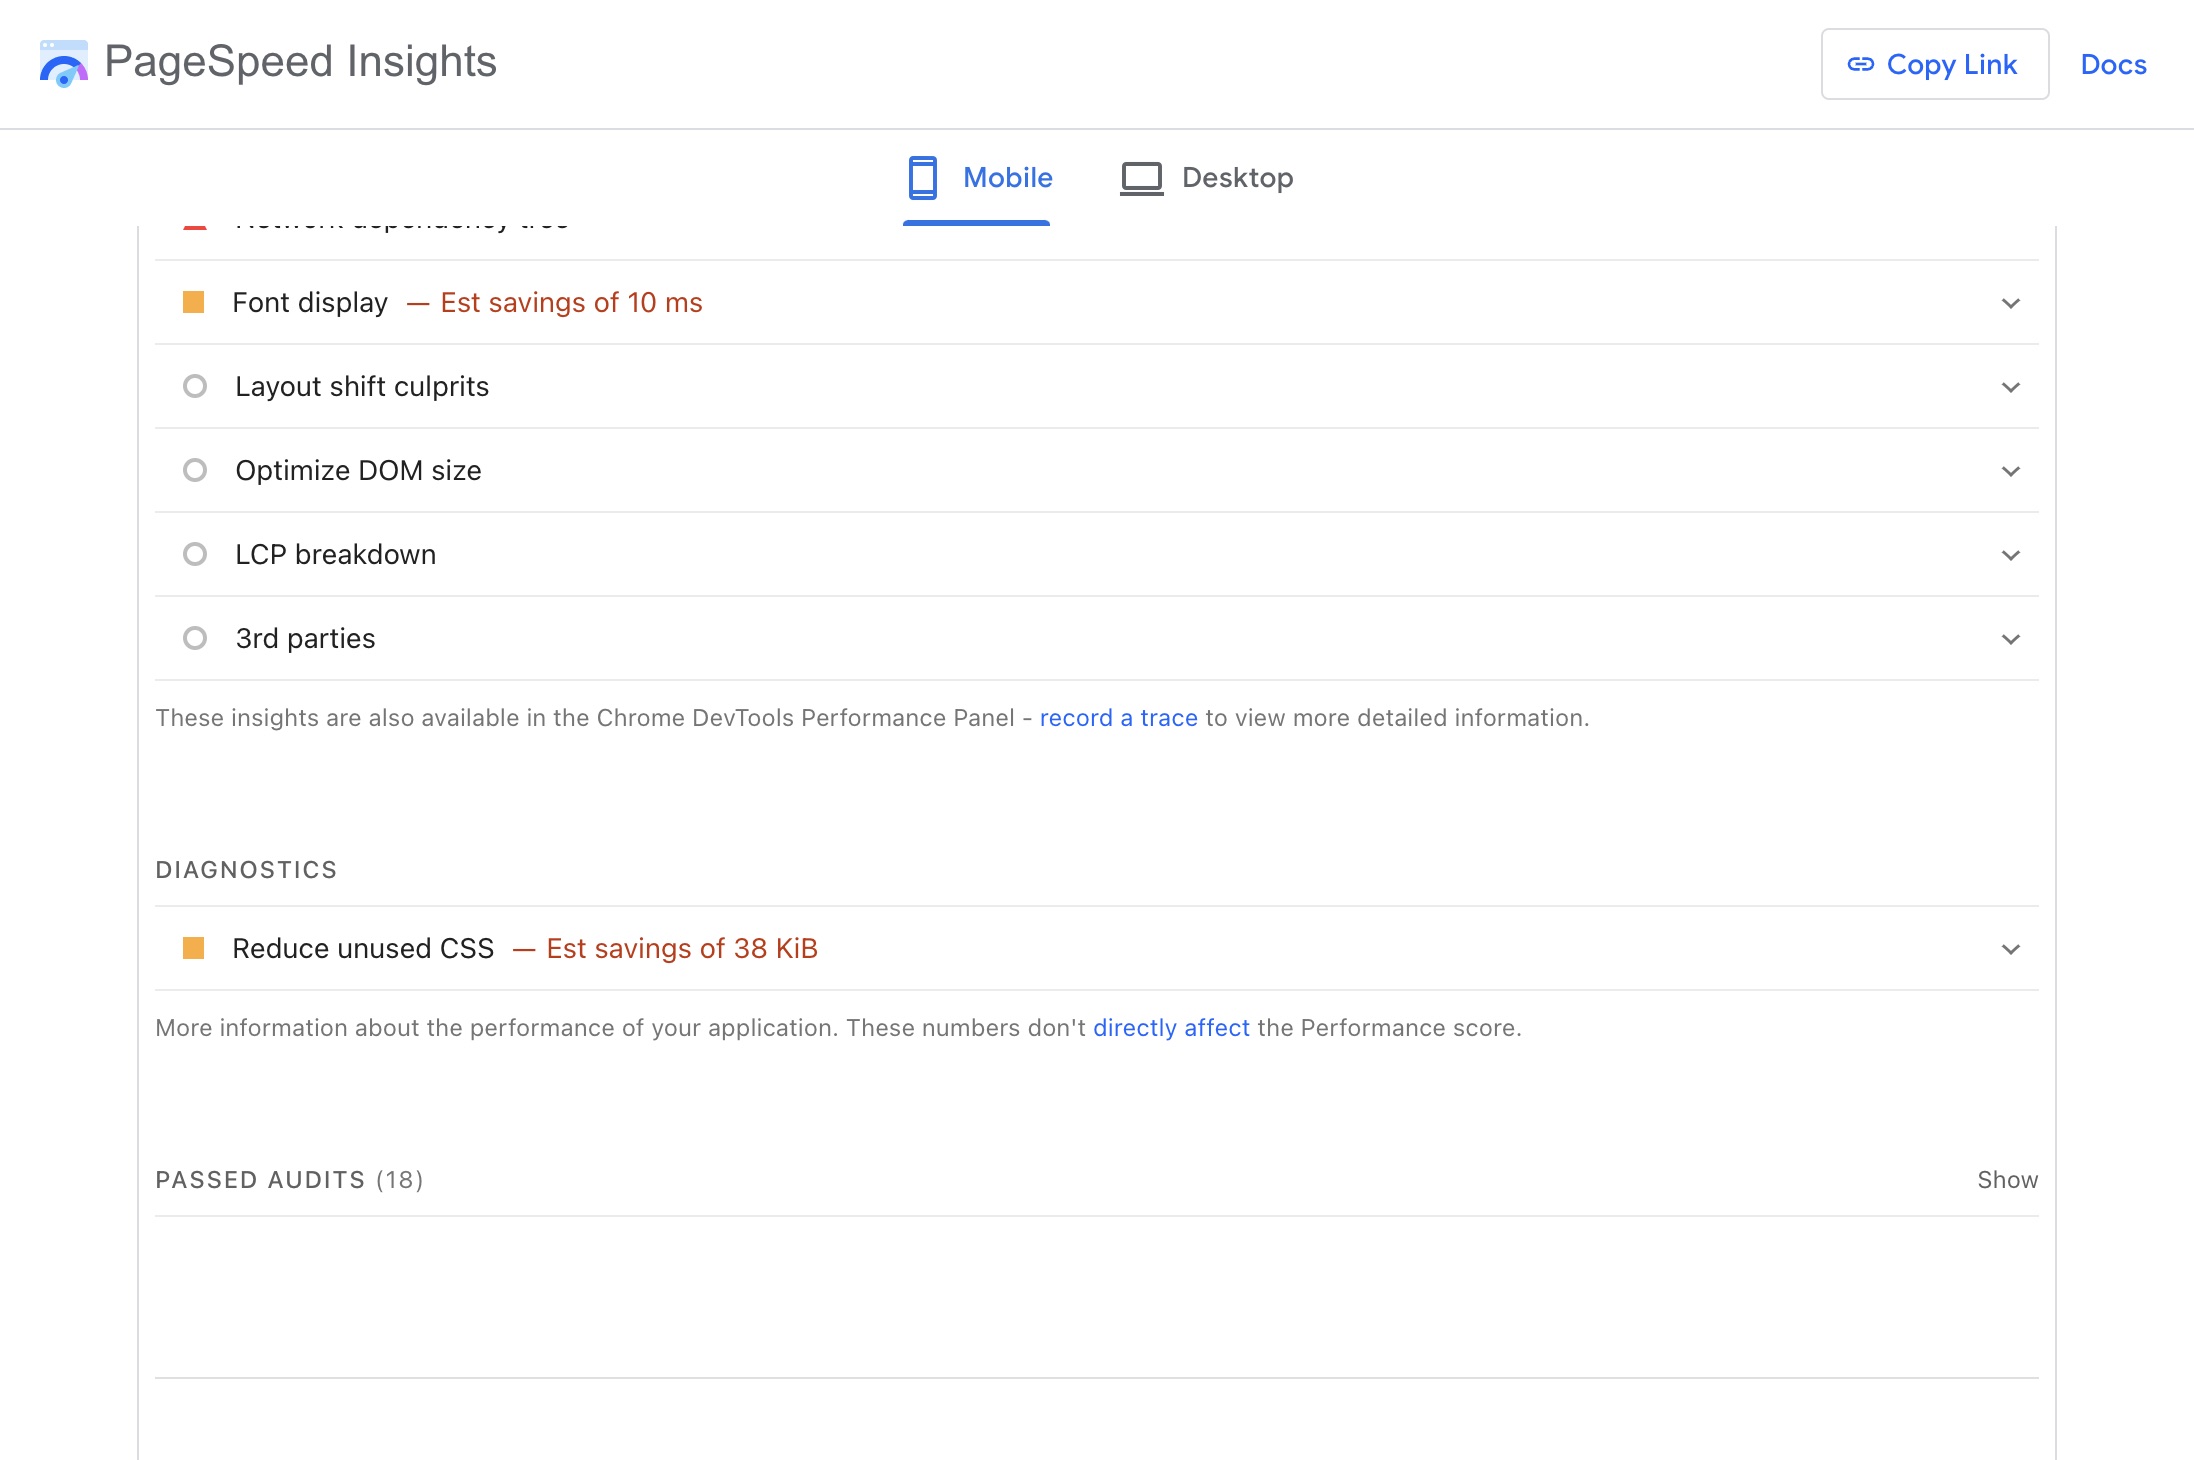
While Lighthouse measures Total Blocking Time (TBT) rather than INP directly, TBT is a strong lab proxy for INP. Reducing TBT almost always improves INP.
For a more detailed guide on reading PageSpeed reports, see my post on understanding PageSpeed Insights for WordPress.
Chrome DevTools Performance Panel
For hands-on debugging, open Chrome DevTools (F12), go to the Performance tab, and record a session while interacting with your page. Look for the “Interactions” lane in the timeline – it shows each interaction’s duration broken down into the three phases.
Web Vitals Chrome Extension
The Web Vitals Chrome extension shows real-time INP values as you browse. It’s useful for quick spot-checks during development and testing.
What Causes Poor INP in WordPress
WordPress sites have some common patterns that lead to poor INP scores. Here are the most frequent culprits.
1. Third-Party Scripts
Analytics trackers, chat widgets, ad networks, social media embeds, and marketing pixels all add JavaScript that runs on the main thread. When a user interacts with your page while one of these scripts is executing, the browser can’t respond until the script finishes.
Google Tag Manager alone can add dozens of tags, each running their own JavaScript. Facebook Pixel, Hotjar session recordings, and live chat widgets are also common offenders.
2. Heavy Themes and Plugins
Page builders like Elementor and Divi load significant amounts of JavaScript and generate large DOM trees. Slider plugins, mega menu plugins, and WooCommerce extensions all contribute to main-thread congestion.
The more plugins you activate, the more JavaScript gets enqueued on every page load – even if the visitor never interacts with those features.
3. Large DOM Size
WordPress page builders are known for generating deeply nested HTML structures. A single Elementor section can produce dozens of wrapper div elements. When the DOM exceeds 1,500 nodes, every style recalculation and layout pass takes longer, increasing the presentation delay phase.
For specific strategies to address this, check out my guide on avoiding excessive DOM size in WordPress.
4. Unoptimized Event Handlers
Scroll listeners without throttling, resize handlers that trigger layout recalculations, and click handlers that do synchronous DOM reads followed by writes (layout thrashing) all increase processing time.
How to Optimize INP in WordPress
The optimization strategies below target each of the three INP phases. Start with the ones that give you the biggest gains for the least effort.
A. Defer and Delay Non-Critical JavaScript
The single most impactful thing you can do for INP is to get JavaScript off the main thread during page load. There are two distinct approaches here.
Deferring a script means the browser downloads it in parallel with HTML parsing and executes it after the document is parsed, but before the DOMContentLoaded event. WordPress 6.3+ lets you do this natively with wp_enqueue_script‘s strategy parameter:
wp_enqueue_script(
    'my-script',
    get_template_directory_uri() . '/js/my-script.js',
    array(),
    '1.0',
    array( 'strategy' => 'defer' )
);
Delaying a script means it doesn’t load at all until the user interacts with the page (scroll, click, touch, or keypress). This is more aggressive and more effective for scripts that aren’t needed immediately.
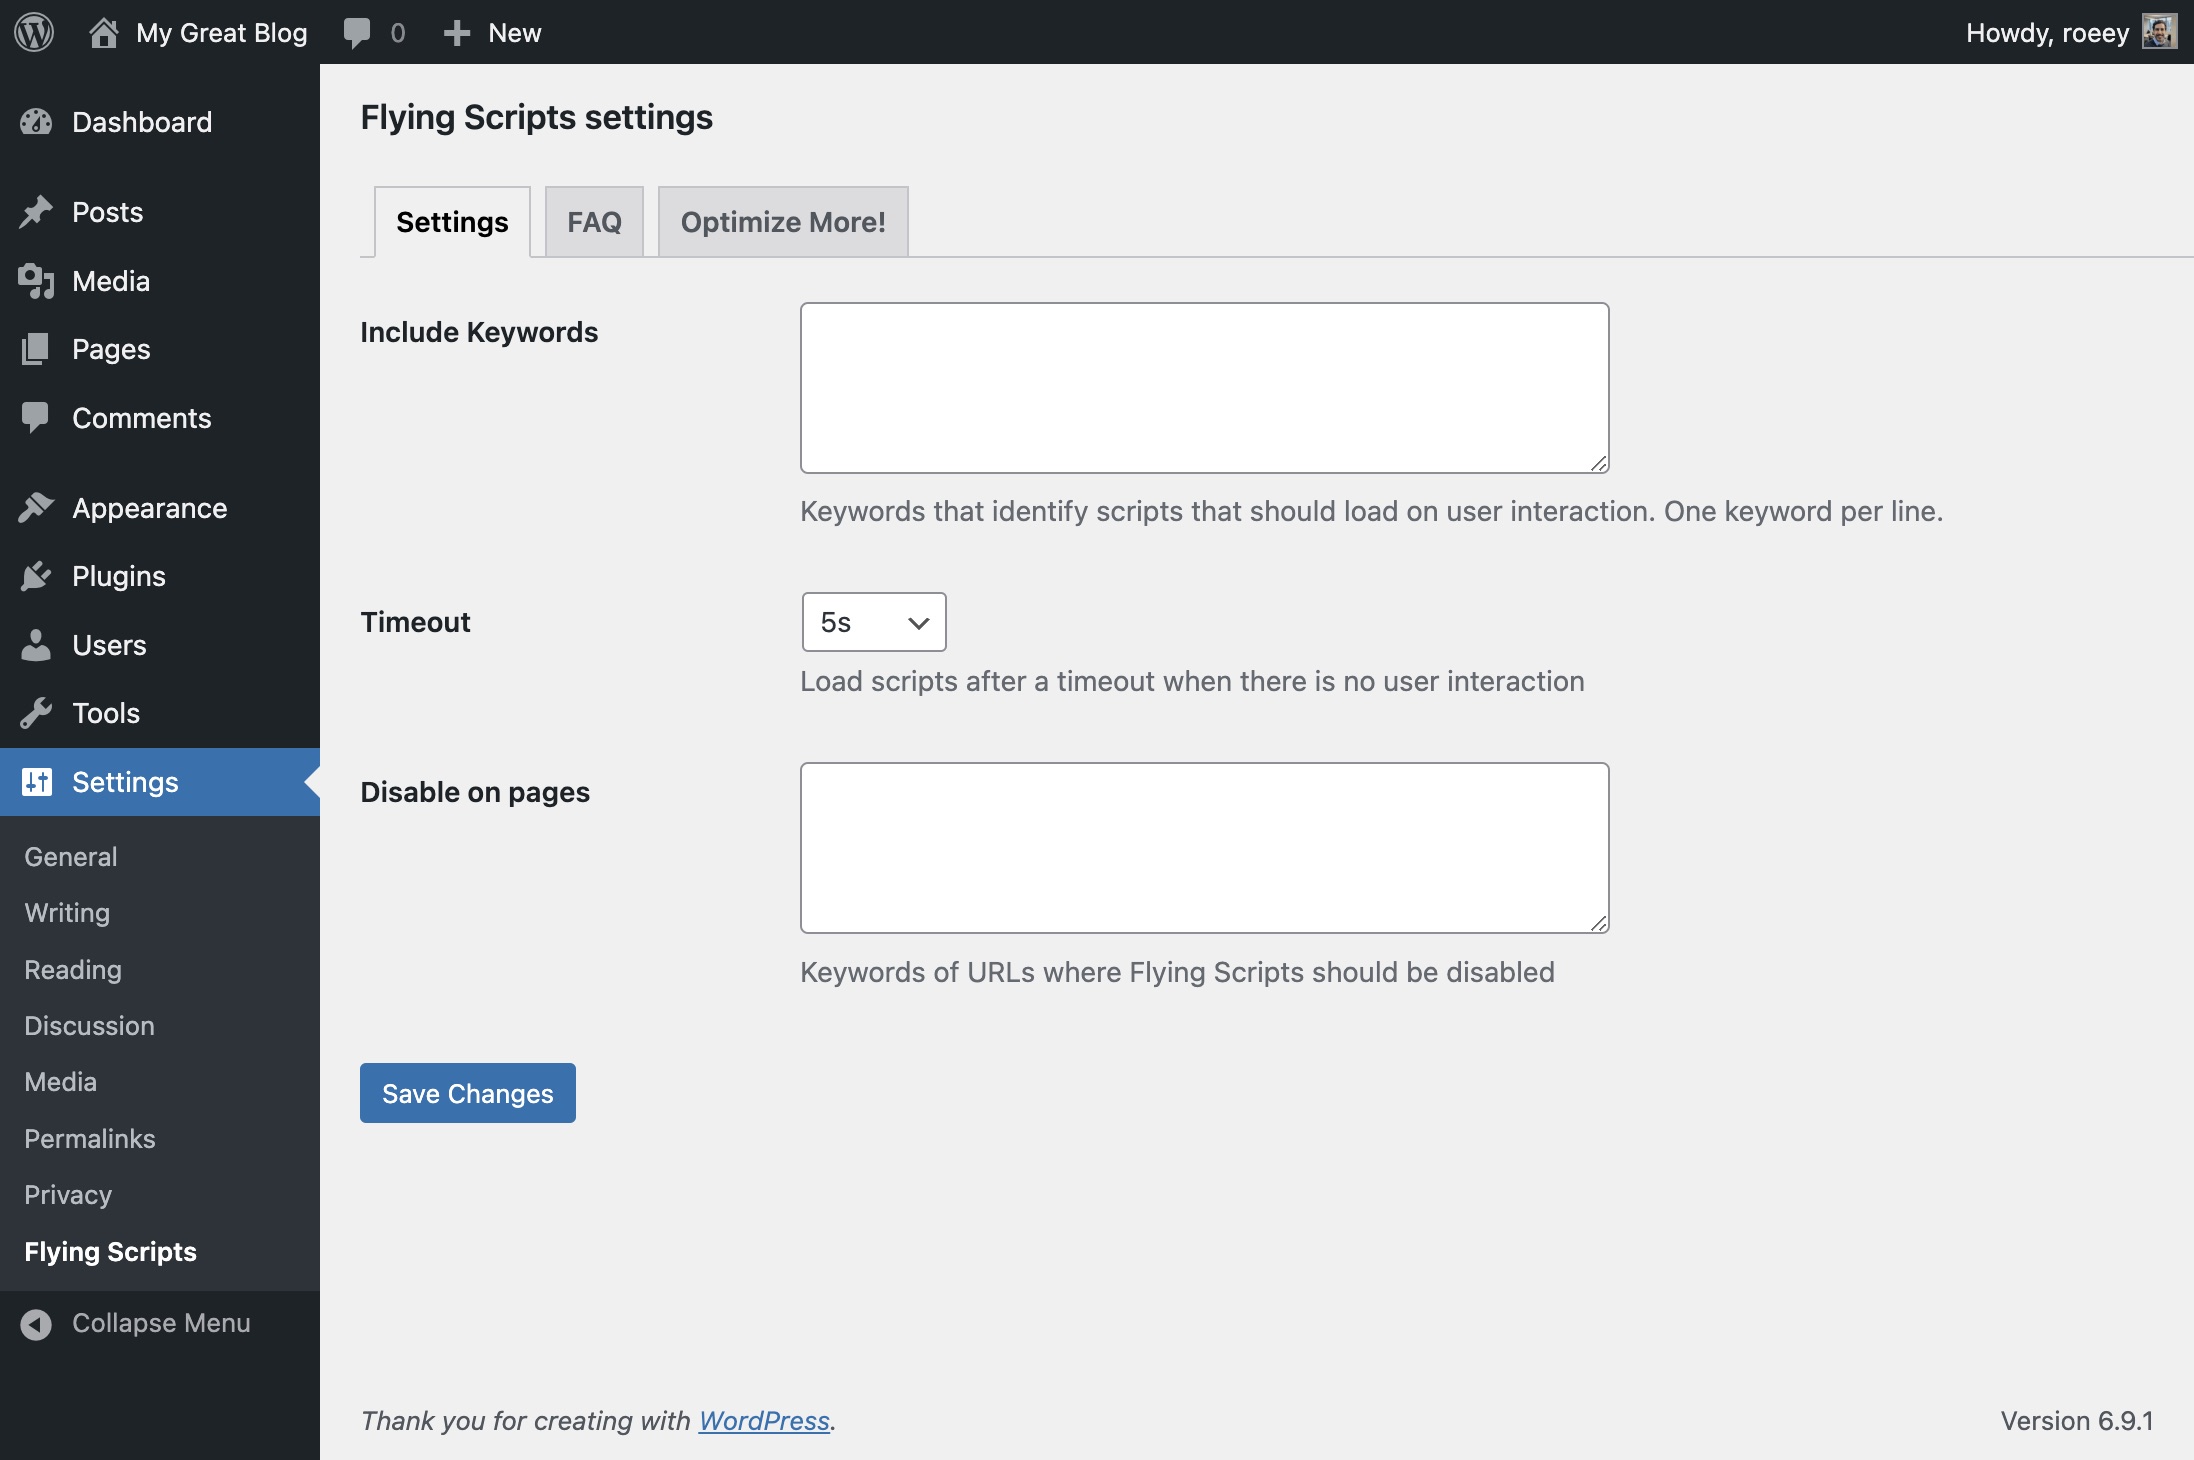
The free Flying Scripts plugin handles this well. You add keywords that identify scripts to delay (e.g. gtag, fbevents, hotjar), and they won’t execute until the user’s first interaction or a timeout you set.
Premium plugins like WP Rocket and Perfmatters offer the same functionality with additional controls. For more on how WP Rocket handles script exclusions, see my post on excluding scripts from JavaScript deferral.
B. Remove Unused JavaScript and CSS
Every JavaScript and CSS file the browser loads is work the main thread needs to handle. Removing what you don’t need reduces both input delay and presentation delay.
Use a plugin like Asset CleanUp or Perfmatters to disable scripts and styles on pages where they’re not needed. For example, if you use Contact Form 7, its JavaScript and CSS load on every page by default – but you only need them on your contact page.
Steps to audit unused assets:
- Open Chrome DevTools and go to the Coverage tab (Ctrl+Shift+P, type “coverage”)
- Click the reload button to start recording
- Check the “Unused Bytes” column – anything above 70-80% unused is a candidate for removal
- Use Asset CleanUp in the WordPress admin to disable those assets on pages where they’re not needed
C. Reduce DOM Size
A smaller DOM means faster style recalculations and layout passes, which directly reduces presentation delay.
If you’re using a page builder, consider switching to native WordPress blocks for simpler layouts. The block editor generates cleaner HTML with fewer wrapper elements.
For WooCommerce stores, product listing pages can get very large. Implement pagination or “load more” instead of showing all products at once. Keep your DOM under 1,500 nodes when possible.
D. Optimize Event Handlers and Third-Party Scripts
If you write custom JavaScript for your WordPress site, keep event handlers lean.
Throttle scroll and resize listeners. Instead of running code on every scroll event (which can fire hundreds of times per second), use requestAnimationFrame or a throttle function:
let ticking = false;
document.addEventListener('scroll', () => {
    if (!ticking) {
        requestAnimationFrame(() => {
            // your scroll logic here
            ticking = false;
        });
        ticking = true;
    }
});
Avoid layout thrashing. Don’t read layout properties (like offsetHeight or getBoundingClientRect()) and then immediately write to the DOM in a loop. Batch your reads, then batch your writes:
// Bad: causes layout thrashing
elements.forEach(el => {
    const height = el.offsetHeight; // read (forces layout)
    el.style.height = height + 10 + 'px'; // write
});

// Good: batch reads, then batch writes
const heights = elements.map(el => el.offsetHeight);
elements.forEach((el, i) => {
    el.style.height = heights[i] + 10 + 'px';
});
E. Break Up Long Tasks with scheduler.yield()
Long tasks (anything over 50 ms) block the main thread and increase input delay. The scheduler.yield() API lets you break a long task into smaller chunks, giving the browser a chance to handle user interactions between them.
async function processItems(items) {
    for (const item of items) {
        doWork(item);

        // Yield to the browser so it can handle interactions
        await scheduler.yield();
    }
}
scheduler.yield() is supported in Chrome 129+, Edge 129+, and Firefox 142+, but not in Safari yet. Use it as a progressive enhancement, or add the scheduler-polyfill package for broader compatibility.
An older alternative that still works everywhere is setTimeout(callback, 0), which yields to the browser but doesn’t preserve task priority the way scheduler.yield() does.
FAQs
Common questions about INP optimization for WordPress:
Summary
INP measures how quickly your site responds to real user interactions – every click, tap, and keypress throughout their visit. It replaced FID in March 2024 because it provides a far more complete picture of responsiveness.
To improve INP on your WordPress site, focus on the three phases: reduce input delay by deferring and delaying non-critical scripts, minimize processing time by keeping event handlers lean, and cut presentation delay by reducing your DOM size.
Start with the free Flying Scripts plugin to delay third-party scripts, audit your plugins for unused JavaScript, and check your DOM node count. Small, targeted changes add up fast.