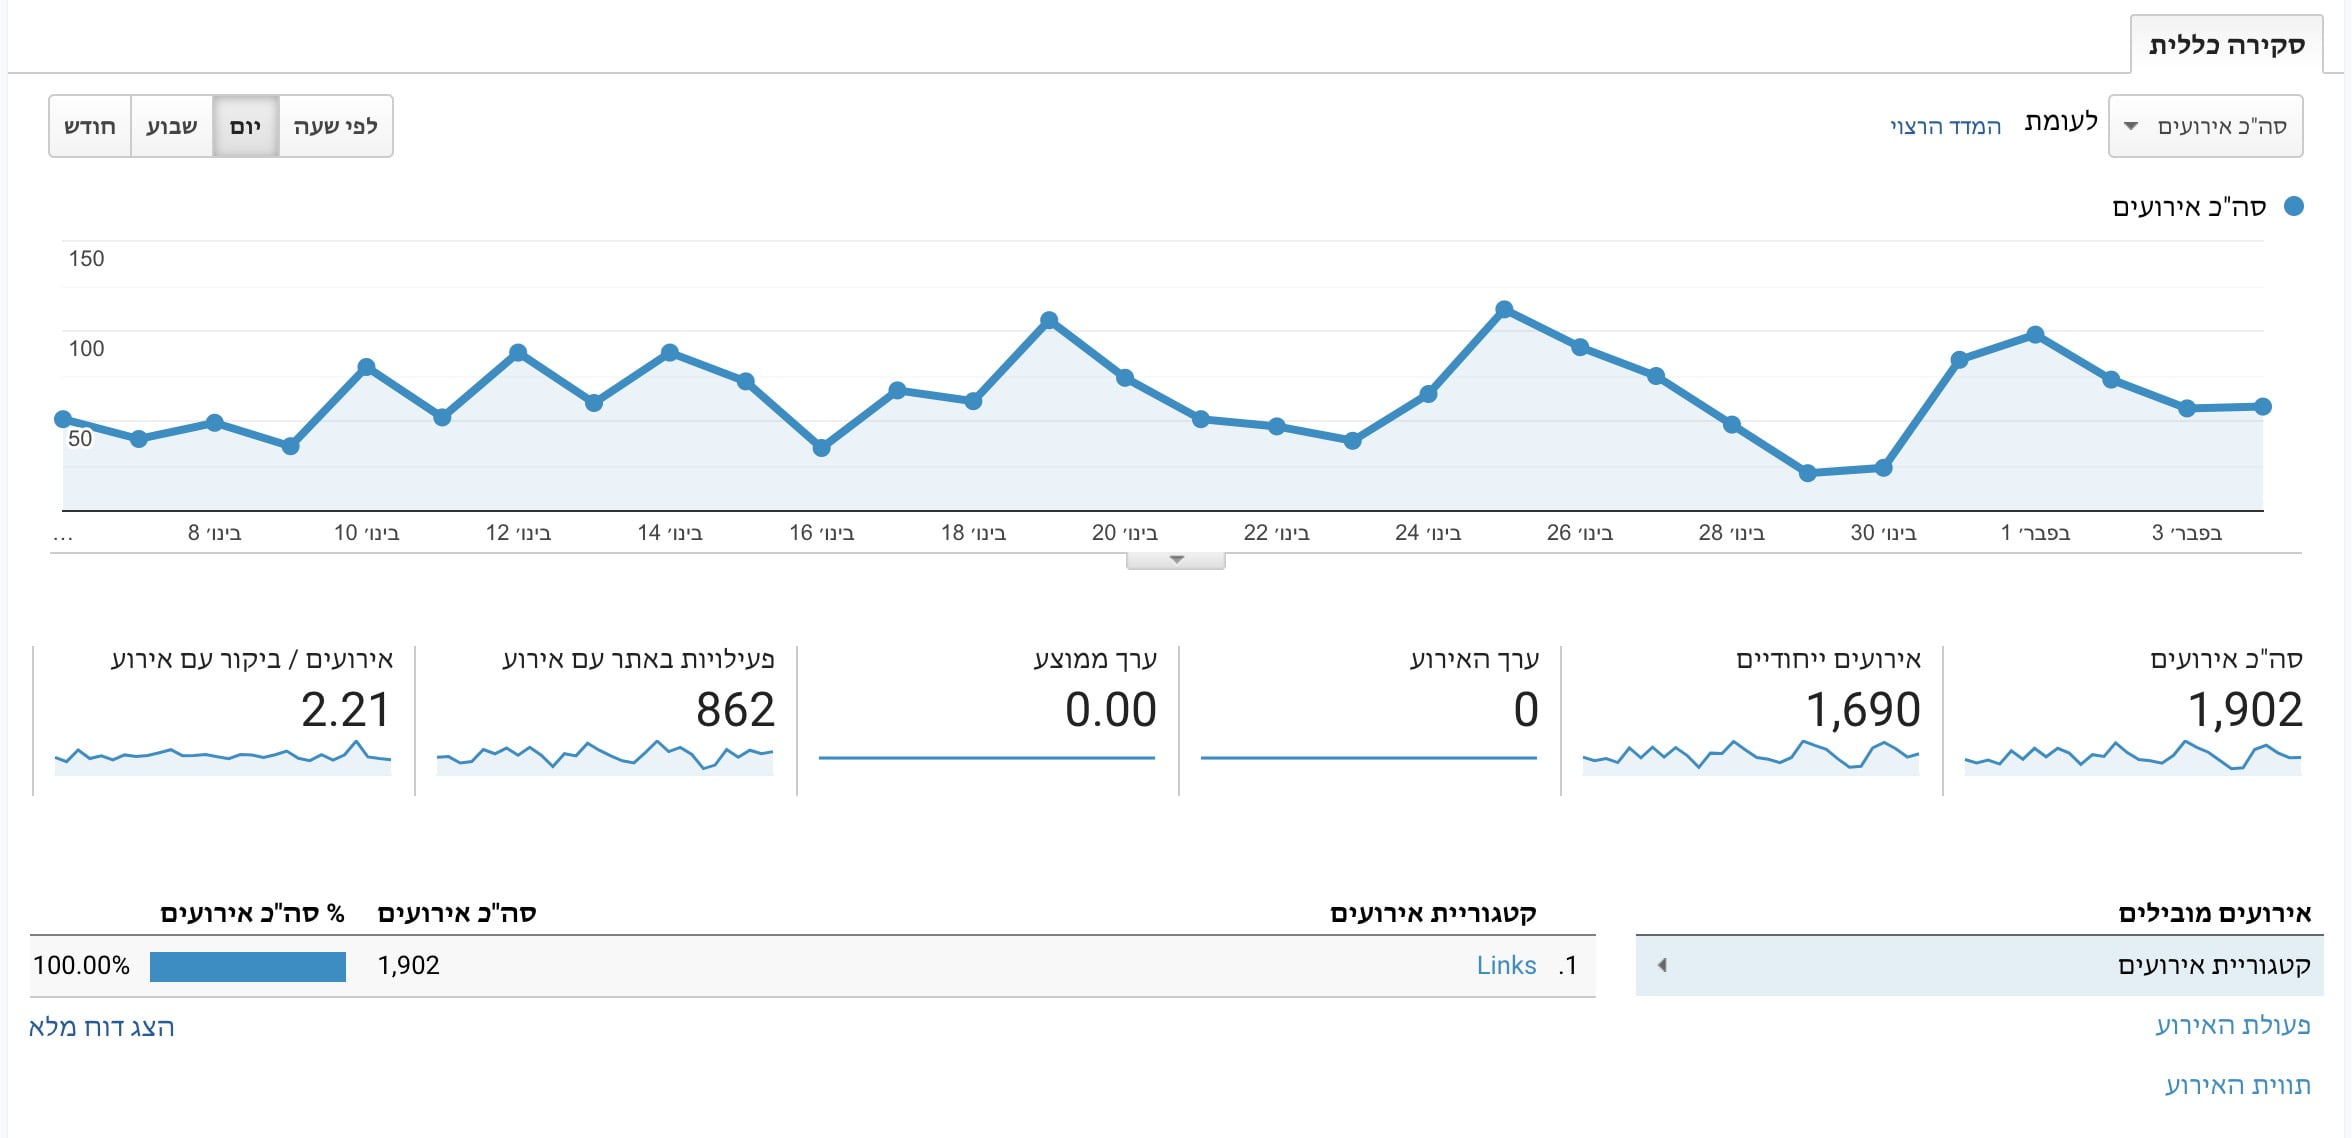
By default, Google Analytics 4 (GA4) measures traffic on your site and tracks basic metrics such as pageviews, bounce rate, and more. However, if you want to track specific user interactions, such as file downloads, link clicks, form submissions, and video views, you need to implement custom event tracking.
In GA4, Events are user interactions that capture specific actions beyond traditional pageviews and are the core building blocks for all tracking. This event-based model enables you to measure user behavior with more flexibility and granularity.
Anatomy of Events in GA4
In GA4, an event can have various parameters that provide context to the action. You can create custom events or use predefined ones that GA4 offers. Key event parameters in GA4 include:
- Event Name: Identifies the specific user interaction.
- Parameters: Additional details about the event (e.g., category, label, action, value in Universal Analytics terms).
For example, if you want to track when a user clicks the play button on a video, you could create an event with the following values:
- Event Name: “video_play”
- Parameter: “Video Title” (e.g., “Introduction to GA4”)

Let’s explore some of the primary components in GA4’s event parameters to help you create meaningful tracking structures:
1. Event Name
The Event Name is the core identifier of each interaction. Names like click, video_play, or form_submit help define what action occurred, making it easier to analyze specific interactions in GA4 reports.
“Carefully naming events is crucial for clear reporting. Choose names that clearly describe the action taken, such as ‘add_to_cart’ or ‘download_pdf’.”
2. Parameters
Parameters in GA4 allow you to add specific context to each event, making it possible to gather additional details about user interactions. Parameters are flexible and can represent anything related to the event. Here are some common parameters and their use cases:
- Page Location: Tracks the specific URL where the event occurred, allowing you to identify which page triggered the interaction.
- Item ID or Item Name: Useful for tracking specific products or content items, such as a product ID in an eCommerce store or the title of a downloaded resource.
- Click Text: Records the text of a clicked button or link, making it easy to see which CTAs are performing well.
- Video Title and Duration: Provides details about which video was played and its length, offering insights into user engagement with multimedia content.
When defining parameters, consider which specific details will provide the most value in reports. Adding too many parameters can make tracking complex, so focus on those that align with your analytics goals.
Here’s an example of tracking a “video_play” event with parameters for the video’s title and duration:
gtag('event', 'video_play', {
  'video_title': 'Introduction to GA4',
  'video_duration': '3:45'
});
Here’s an additional example of tracking a “contact_form_submit” event where the form’s title and page location are captured as parameters:
gtag('event', 'contact_form_submit', {
  'form_title': 'Newsletter Signup',
  'page_location': window.location.href,
  'submission_time': new Date().toISOString()
});
In the first example, video_title and video_duration provide details about the video being played, making it easier to analyze engagement for specific videos. In the second example:
form_titleidentifies the form that was submitted, making it possible to track performance across different forms.page_locationrecords the URL where the event took place, ensuring data accuracy if forms are embedded on multiple pages.submission_timecaptures the exact time of the submission, useful for analyzing peak activity times.
3. Custom Dimensions and Metrics
In GA4, you can also define custom dimensions and metrics to add unique details to events, making it possible to tailor tracking to specific goals.
Example: If you run a membership site, you might add a custom dimension for “Membership Level” to track event interactions among different user groups. This allows deeper segmentation in your reports.
Image: Setting up custom dimensions in GA4.
Marking Events as Conversions
Once you’ve set up custom events, you can mark key ones as conversions to align them with your goals. Conversions in GA4 are essential actions you want users to take, such as making a purchase, submitting a form, or completing a signup.
To mark an event as a conversion in GA4, navigate to Configure > Events, locate the event you wish to track as a conversion, and toggle it as a conversion. GA4 will then track this action as a key performance indicator in reports.
“Defining key conversions is essential for measuring your website’s success in meeting business objectives. Choose conversion actions that directly relate to your goals.”
Best Practices for Events and Conversions in GA4
- Use Descriptive Event Names: Keep names consistent and descriptive to make reports clearer.
- Leverage Parameters: Add parameters like “button_text” and “product_id” to provide context to events.
- Plan Your Conversion Events: Focus on actions that align directly with business objectives, such as purchases or form completions.
Conclusion
GA4’s event-based model allows you to go beyond pageviews and track specific interactions, giving you valuable insights into how users engage with your WordPress site. By setting up custom events and marking critical actions as conversions, you can align analytics with your goals and make data-driven decisions.
For more information on setting up custom events and conversions in GA4, visit Google’s official documentation.


